Color Changes in Metals Caused by Rust and Oxidation

Learn how to quantify color changes on metal surfaces over time due to rust and oxidation.
Overview
Metal surfaces can oxidize when exposed to oxygen, moisture, heat, and other environmental conditions, causing their color to change over time. While these changes are often visible, quantifying the degree of color change can be challenging. In this application example, a 2D color measurement system is used to measure the entire metal surface without contact and evaluate color changes caused by rust and oxidation using both numerical data and images. By analyzing color distribution across the surface, oxidation-related changes and variations in surface condition can be evaluated objectively.
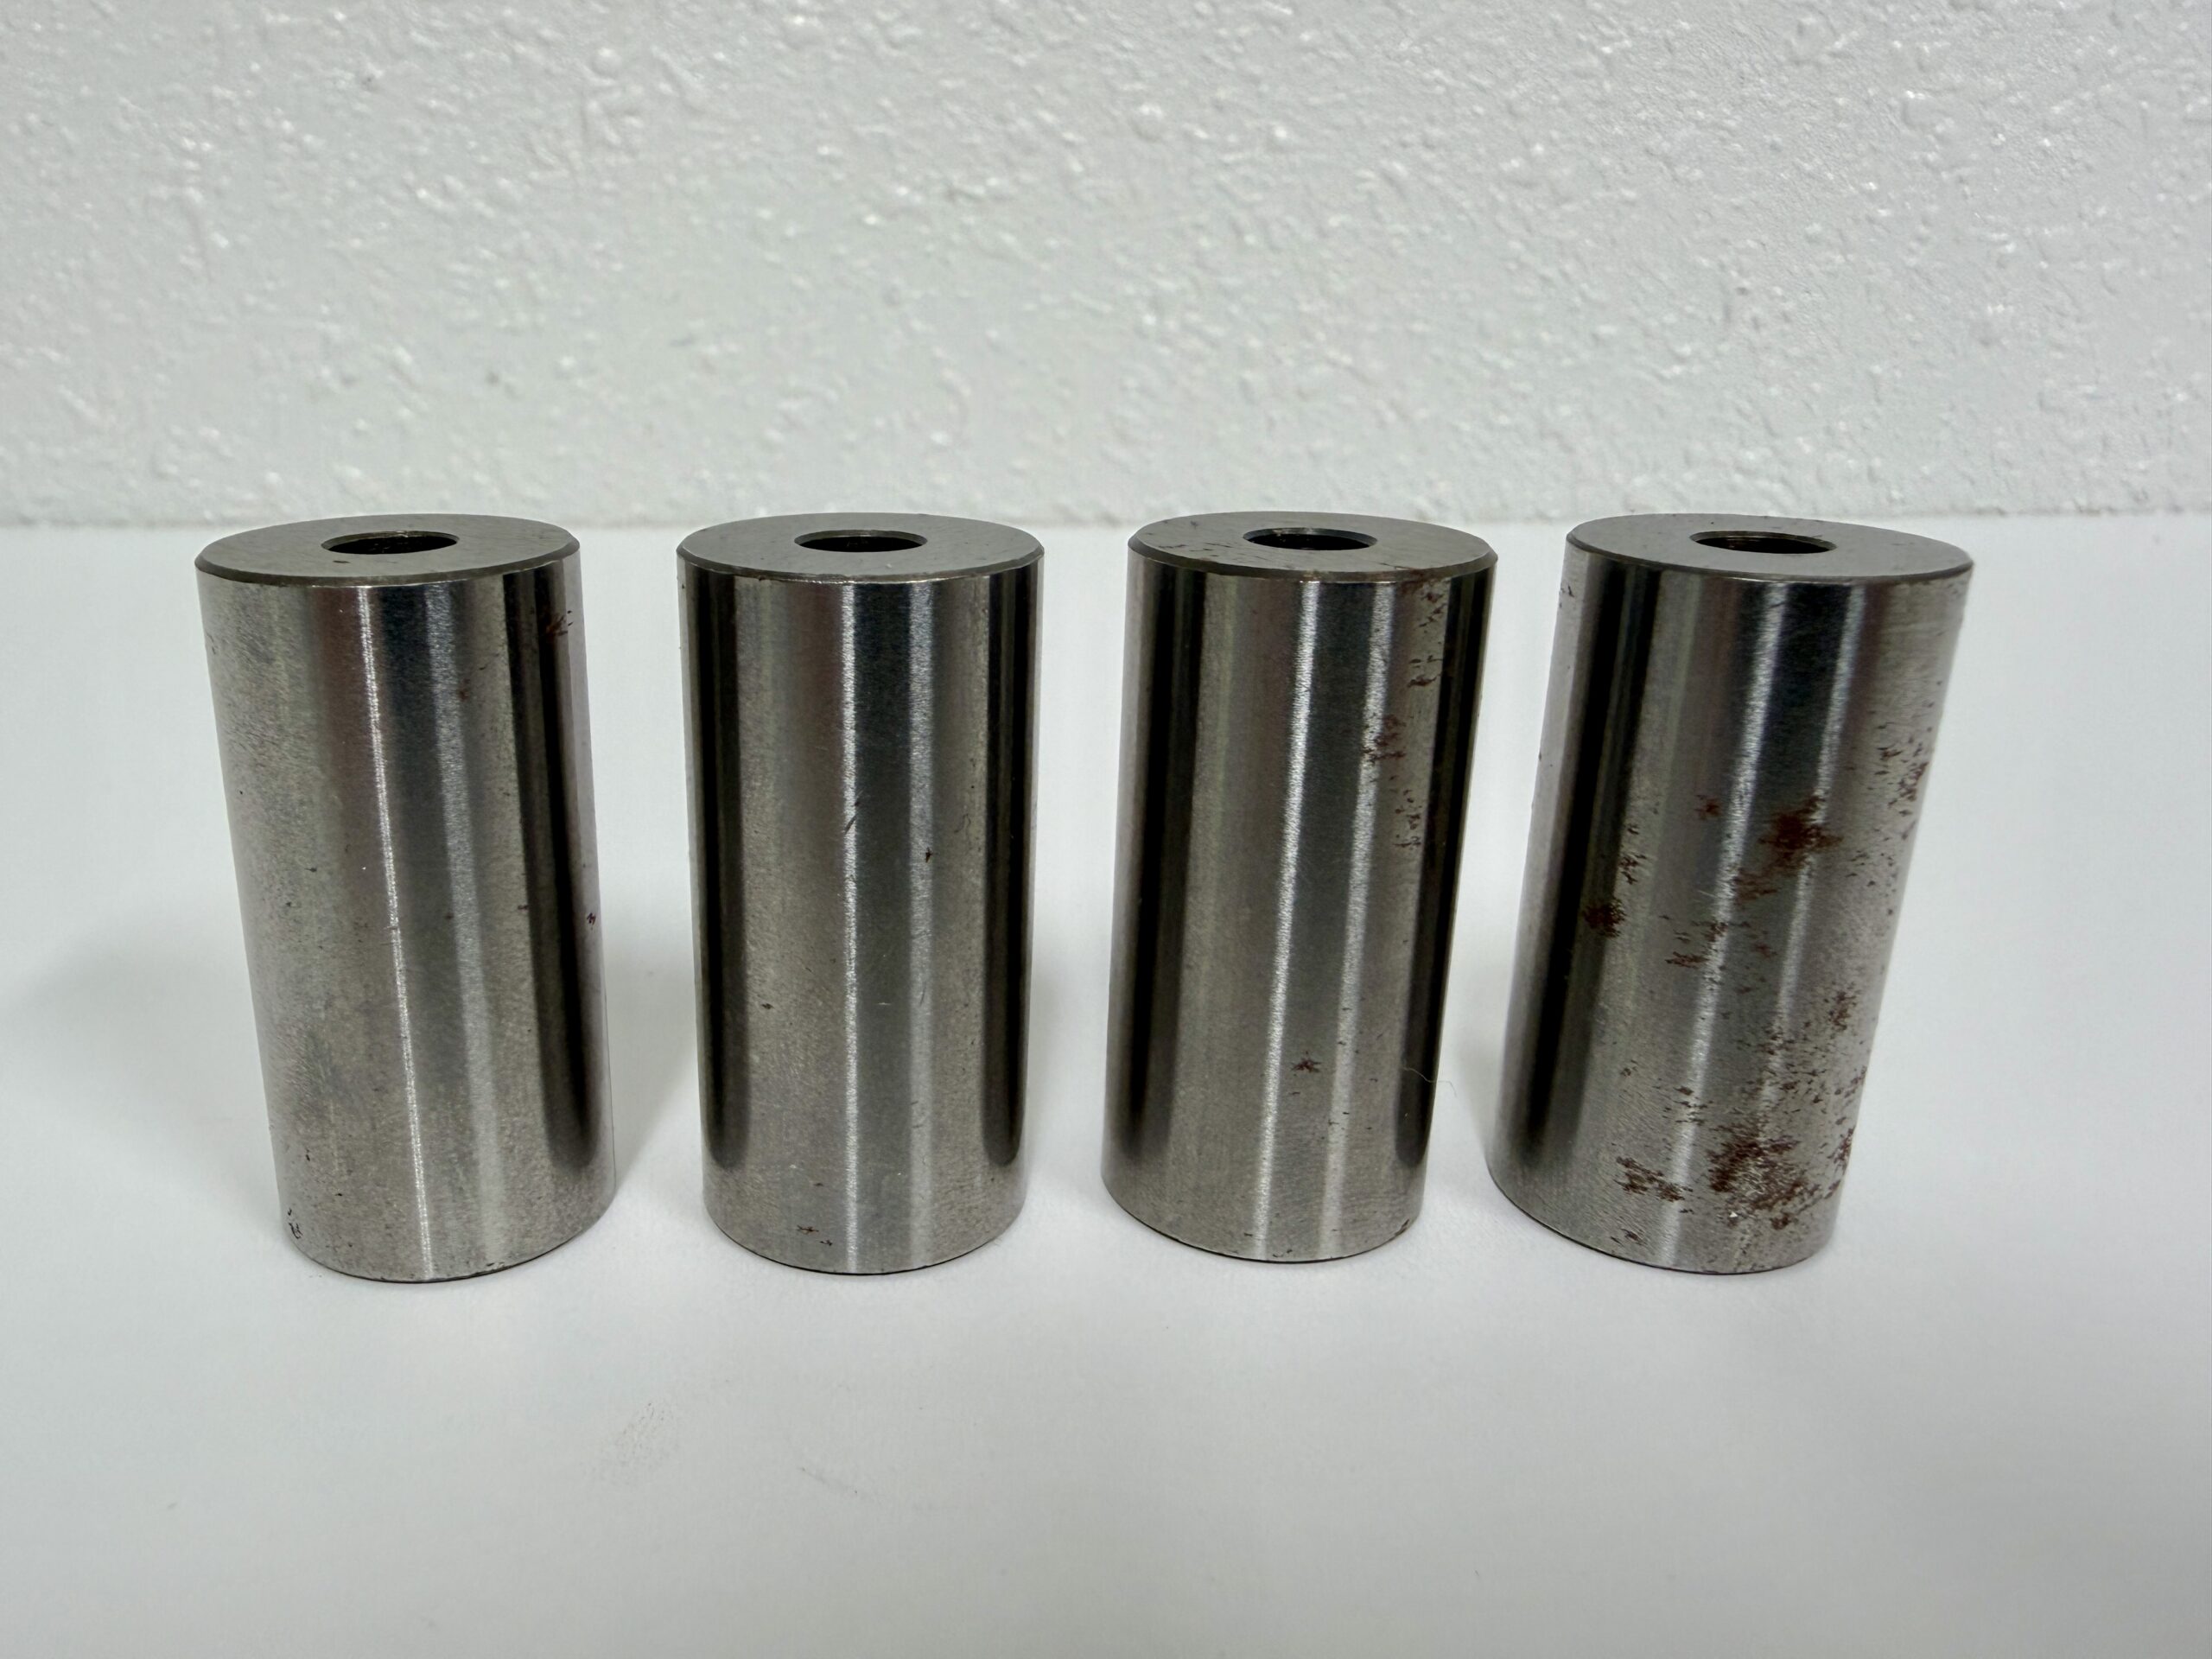
Metal Sample
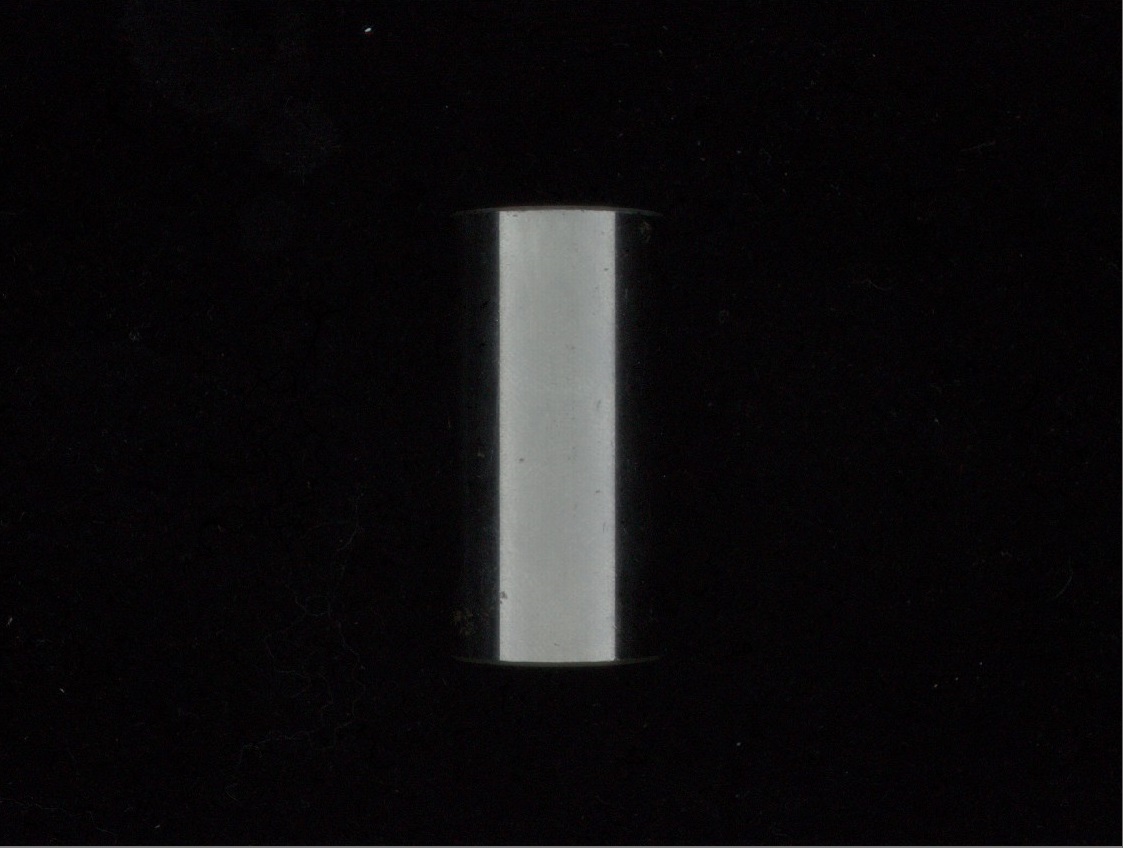
Captured Image
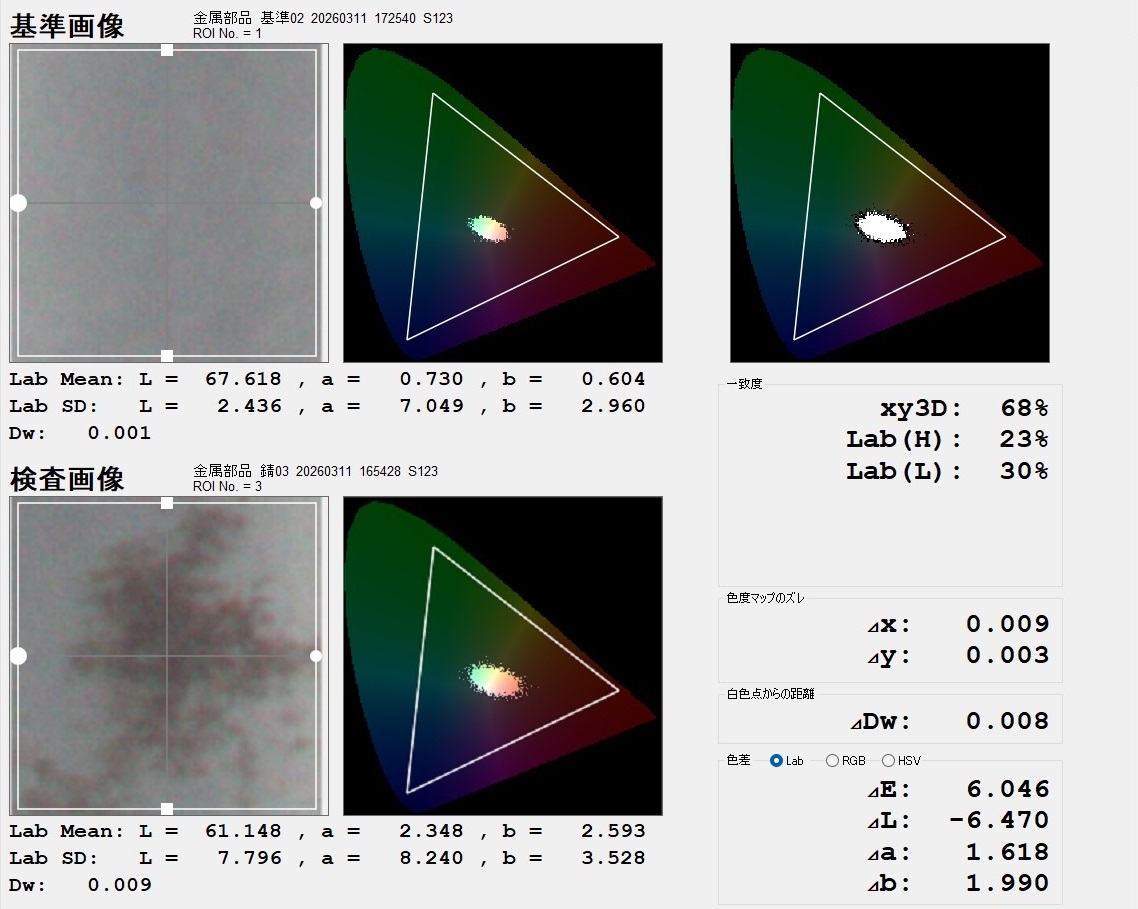
Analysis Results
Customer Challenges
Challenges
Challenges in Measuring Color Changes Caused by Rust and Oxidation
Rust and oxidation can produce visible changes in color, but it can be difficult to quantify the extent of those changes objectively. Visual evaluation can vary from person to person, making consistent comparison of changes over time or differences caused by processing conditions difficult. In addition, contact-based measurement methods may disturb fragile rusted areas or oxide films, creating a need for an evaluation method that preserves the original surface condition.
Benefits After Implementation
Quantifying Rust- and Oxidation-Related Color Changes
A 2D color measurement system enables non-contact measurement of the entire metal surface, allowing color changes in rusted areas and oxide films to be evaluated while preserving the surface condition. Color changes can be quantified using ΔE and L*a*b* values, while captured images can be saved to track changes over time. This approach can be used to evaluate changes during weathering tests and heat-treatment processes, detect color-related abnormalities in quality control, and support the development and evaluation of surface treatments and materials.
Measurement Methods
1. Set the reference:
Capture and save an image of the reference sample. Once registered, the reference can be reused for subsequent comparisons under the same measurement conditions. Click “Add Reference” to complete the setup.
2. Inspect the sample:
Capture an image of the sample to be inspected. The captured data is then ready for analysis.
3. View the results:
Open the Measurement tab to display the inspection results. Measurement data and images can also be exported.
Analysis Image
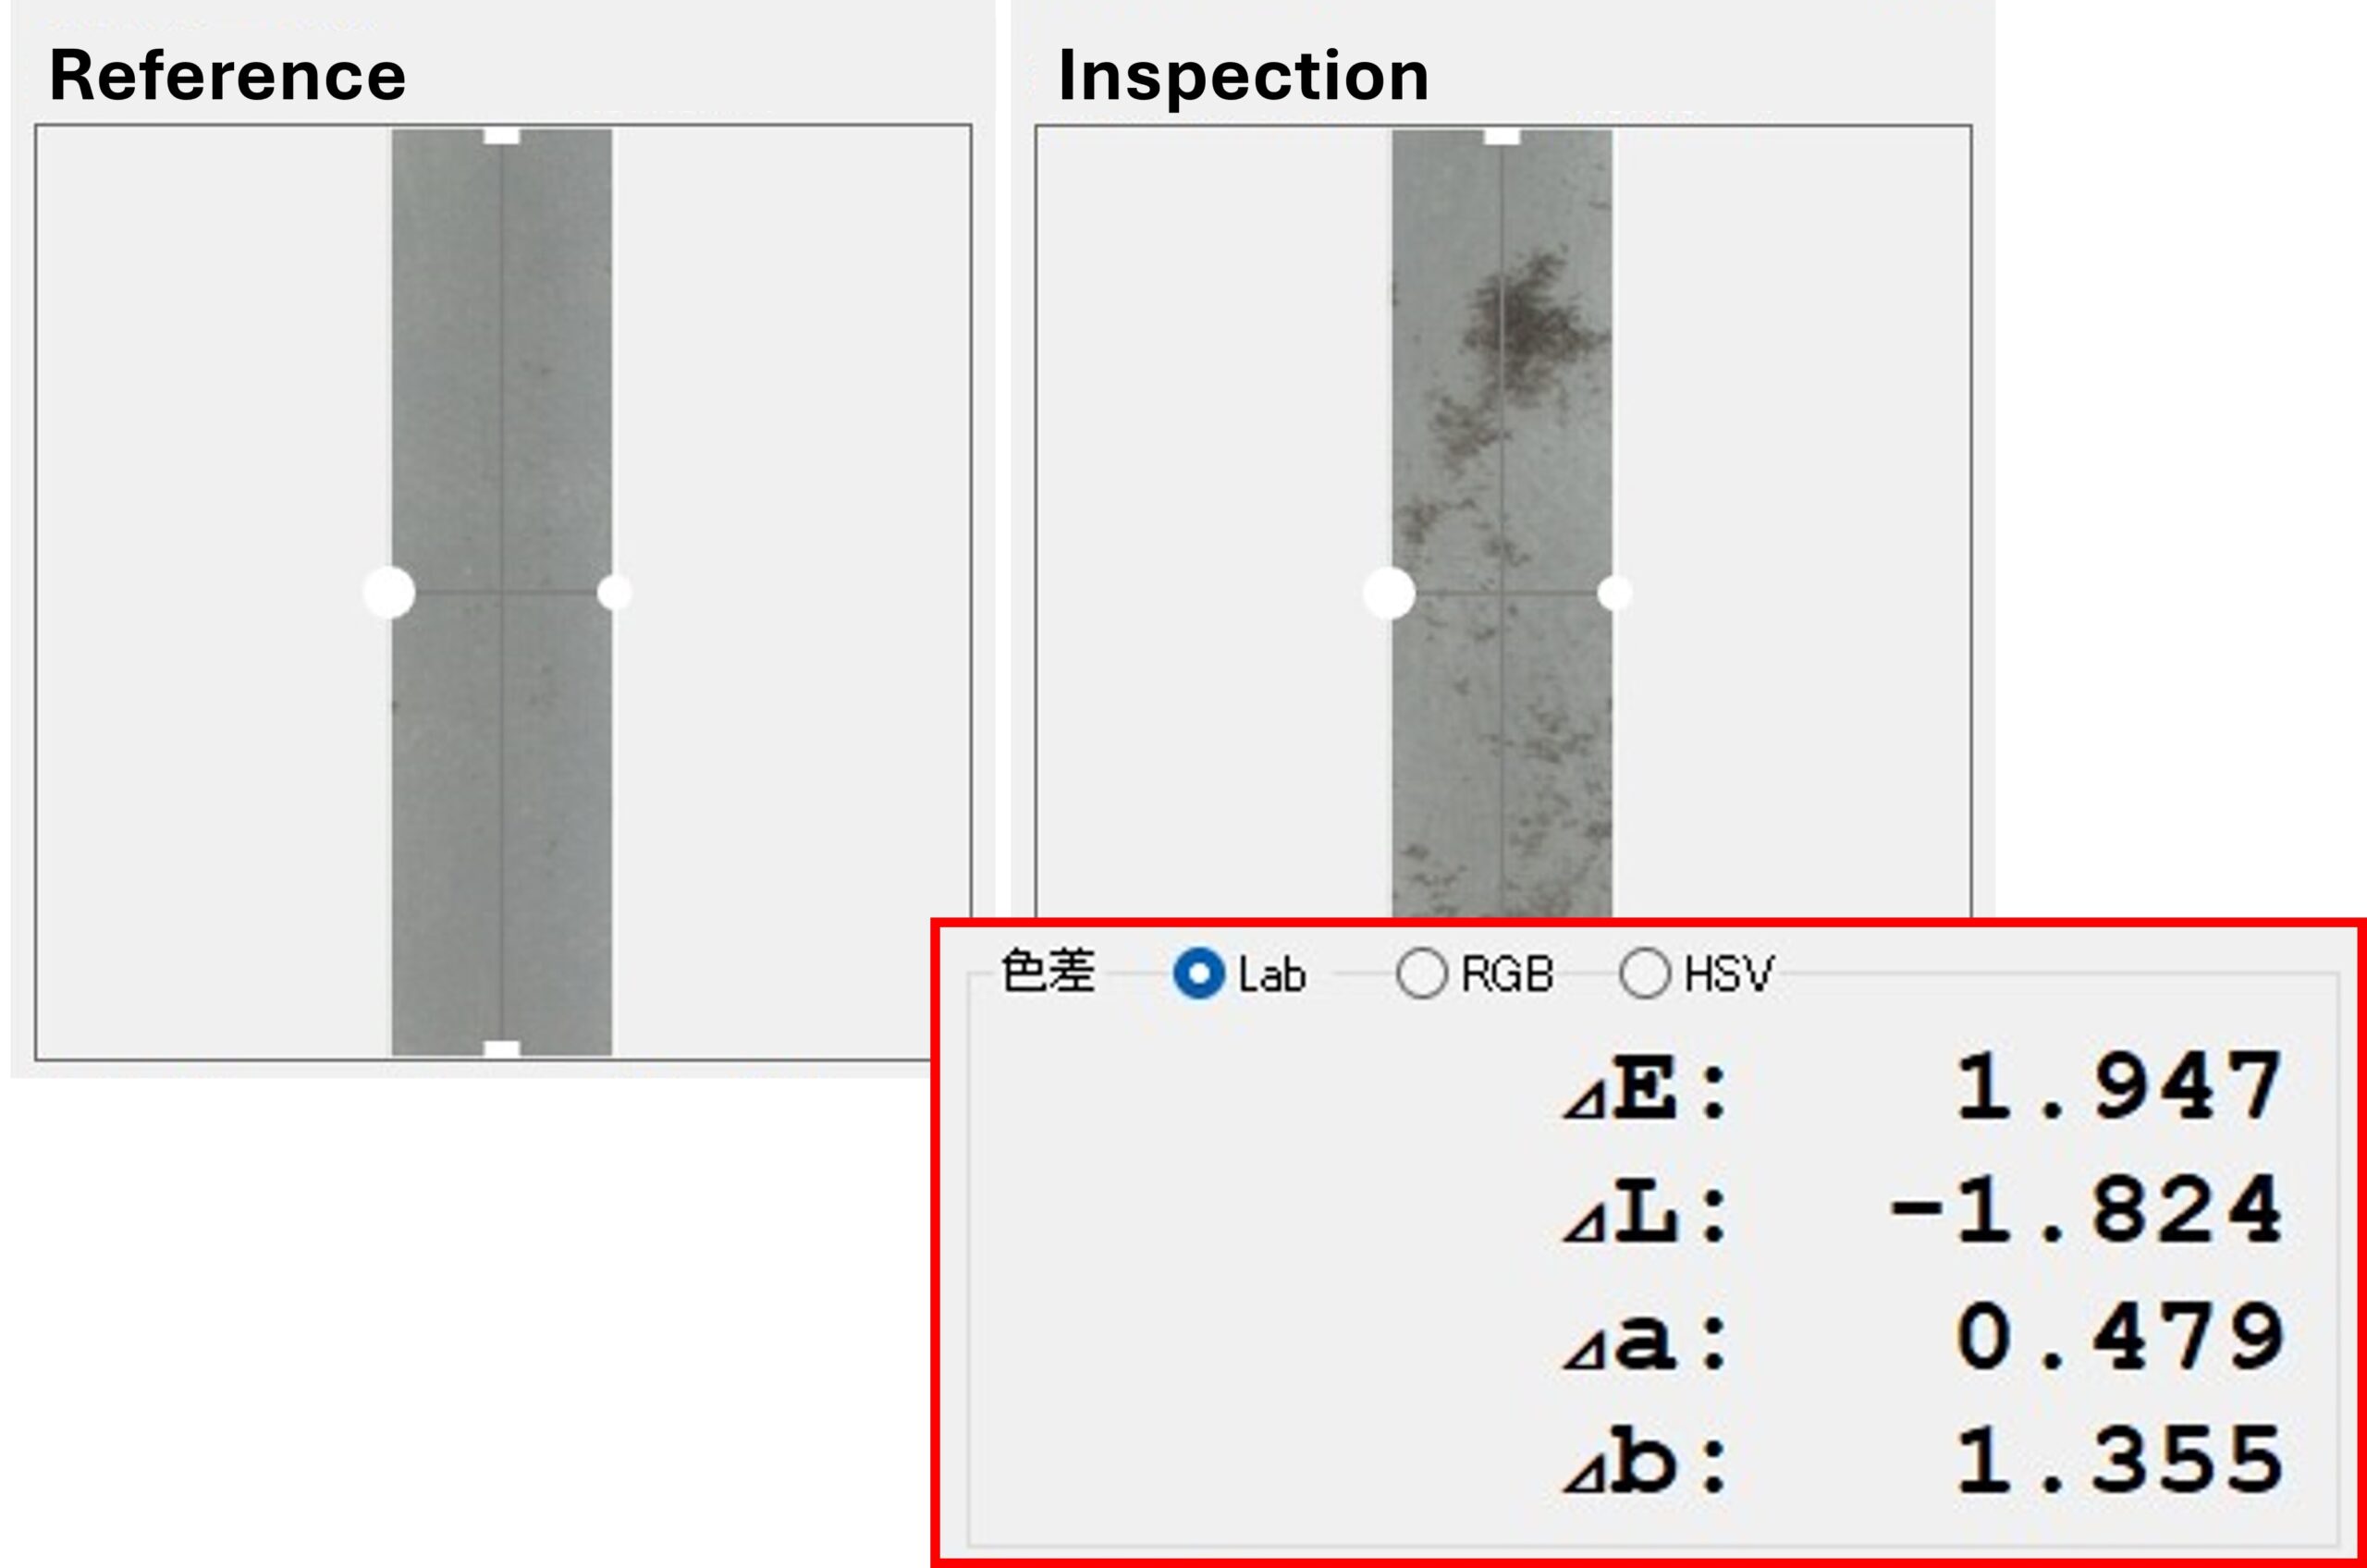
By comparing the sample with a reference sample and calculating the color difference (ΔE), the extent of color change caused by rust or oxidation can be quantified. Comparing measurement data collected over time makes it possible to track oxidation and deterioration quantitatively, making this method useful for weathering tests and long-term monitoring.
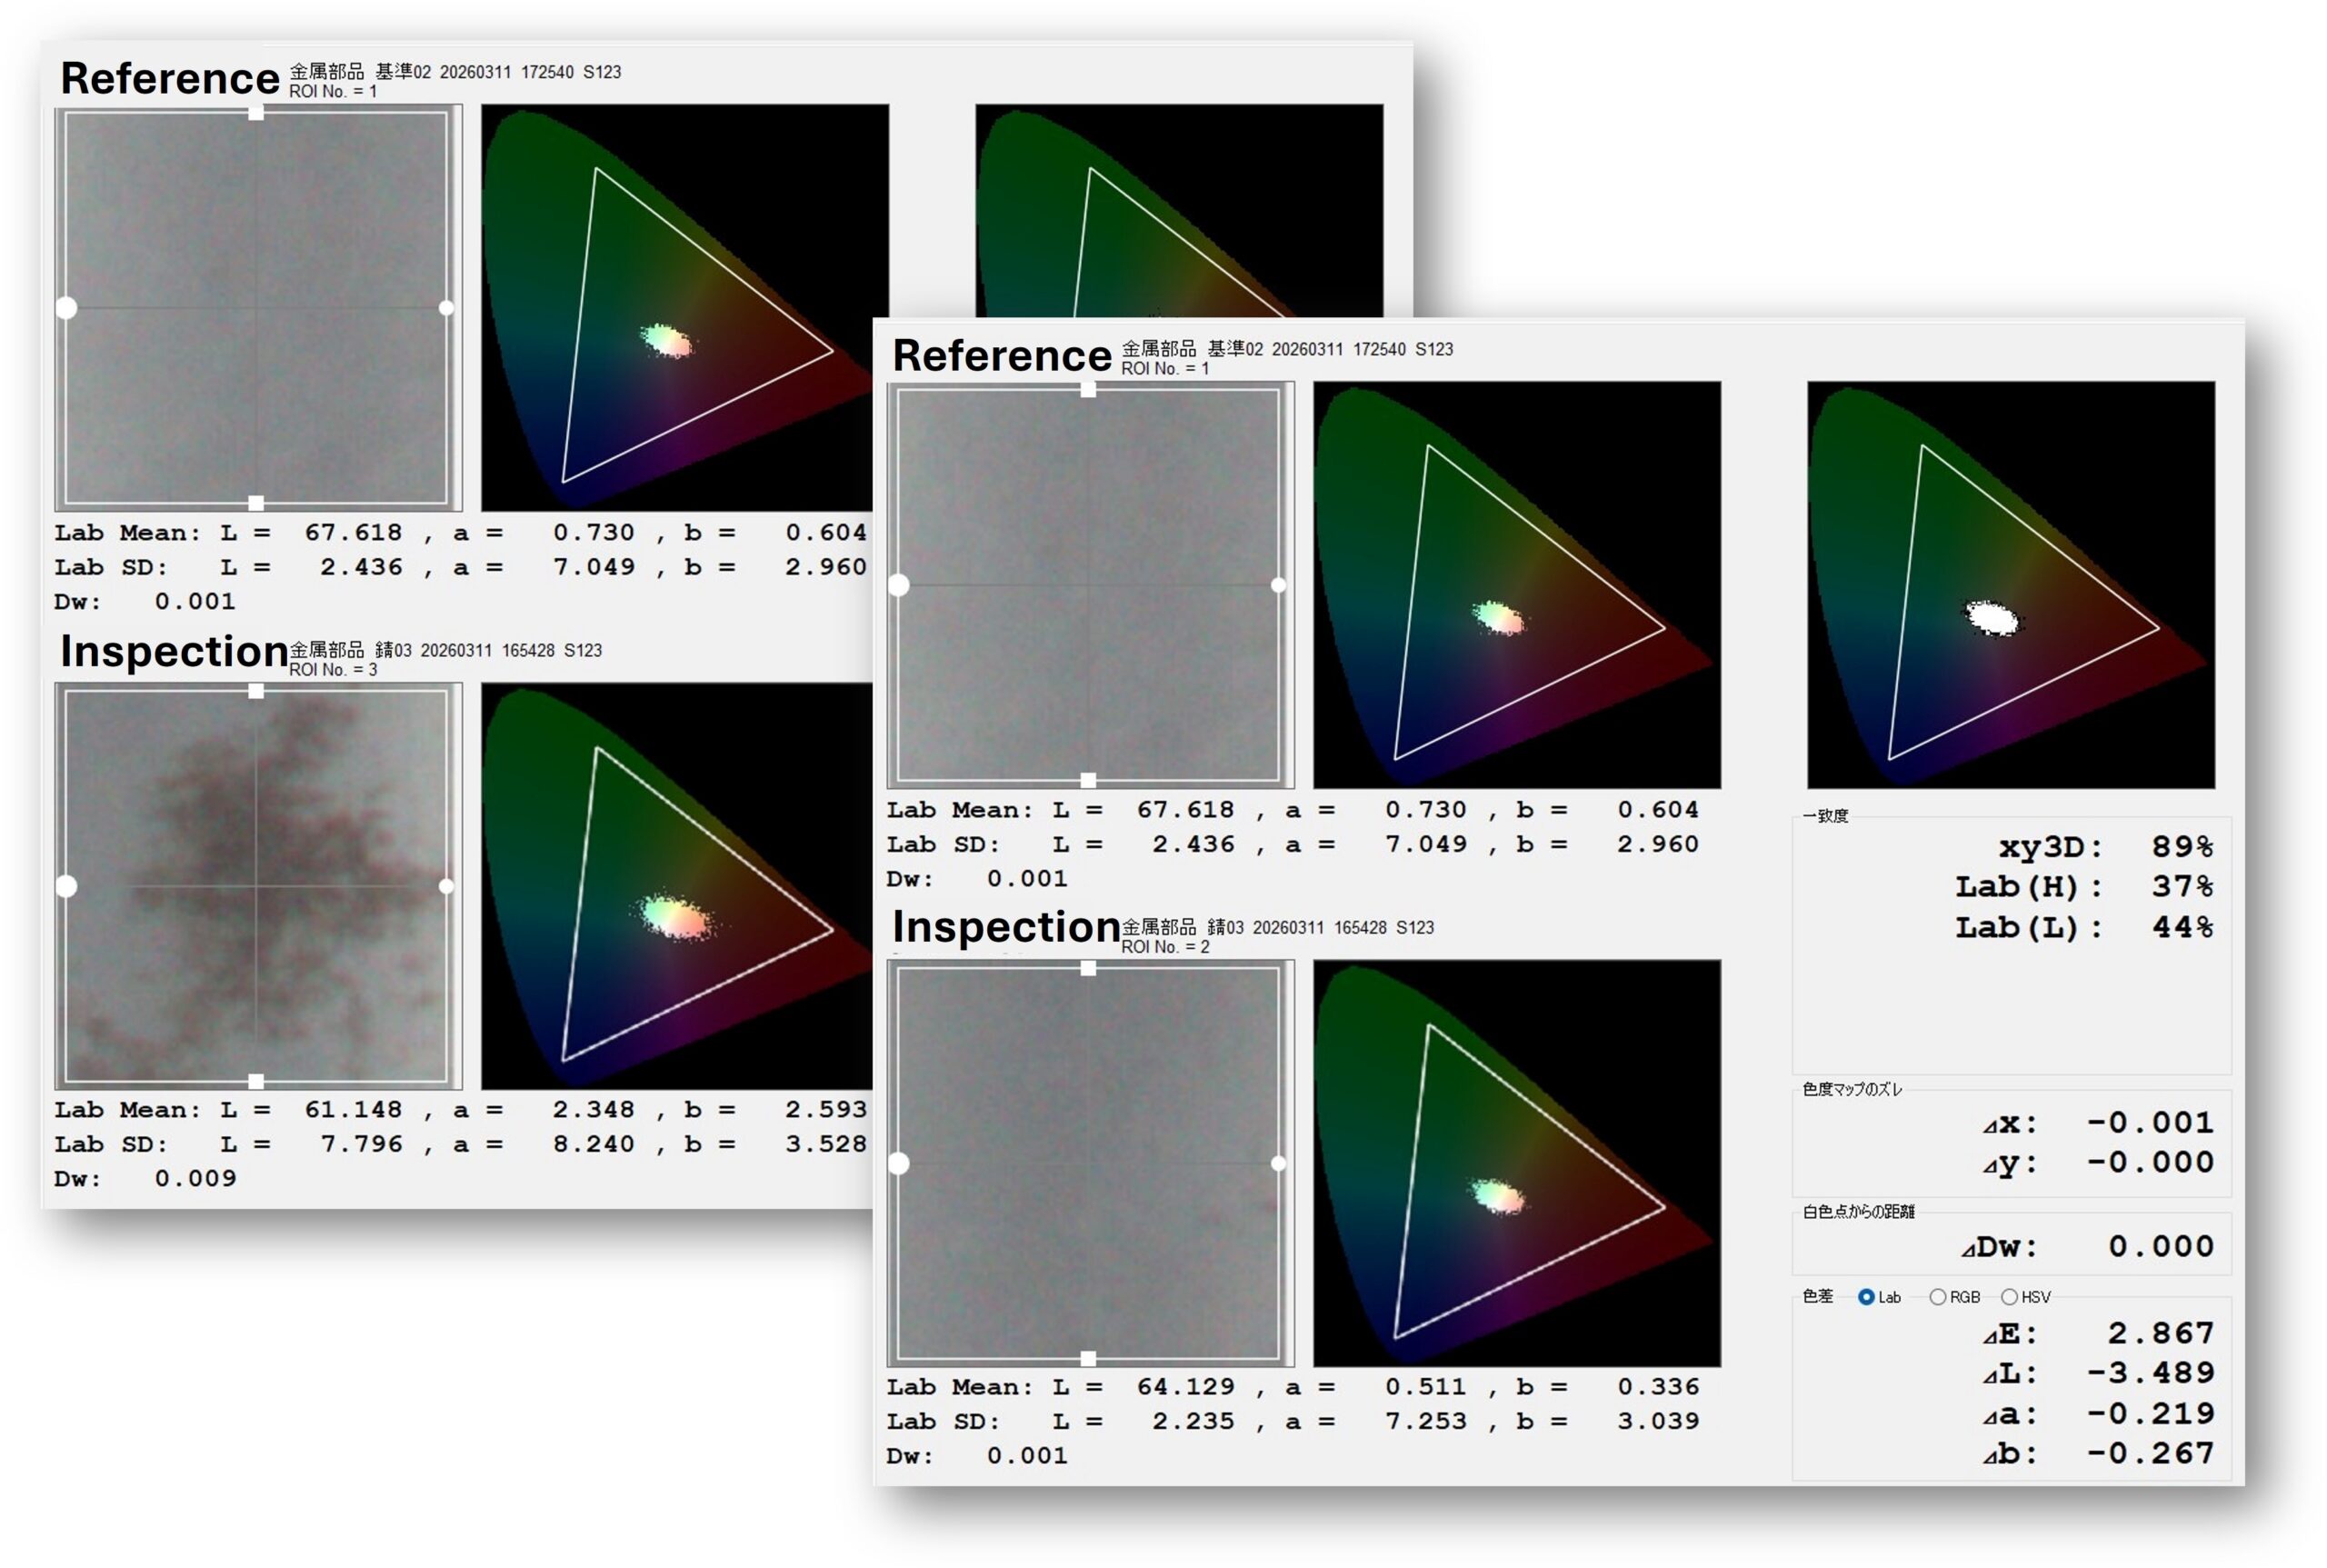
Regions of interest (ROIs) can be selected within the image, allowing heavily rusted regions to be compared with regions showing little or no rust. The degree of oxidation-related color change can be quantified within each selected region, and changes over time can be compared between regions. This objective, data-driven approach supports quality control and the evaluation of deterioration trends.
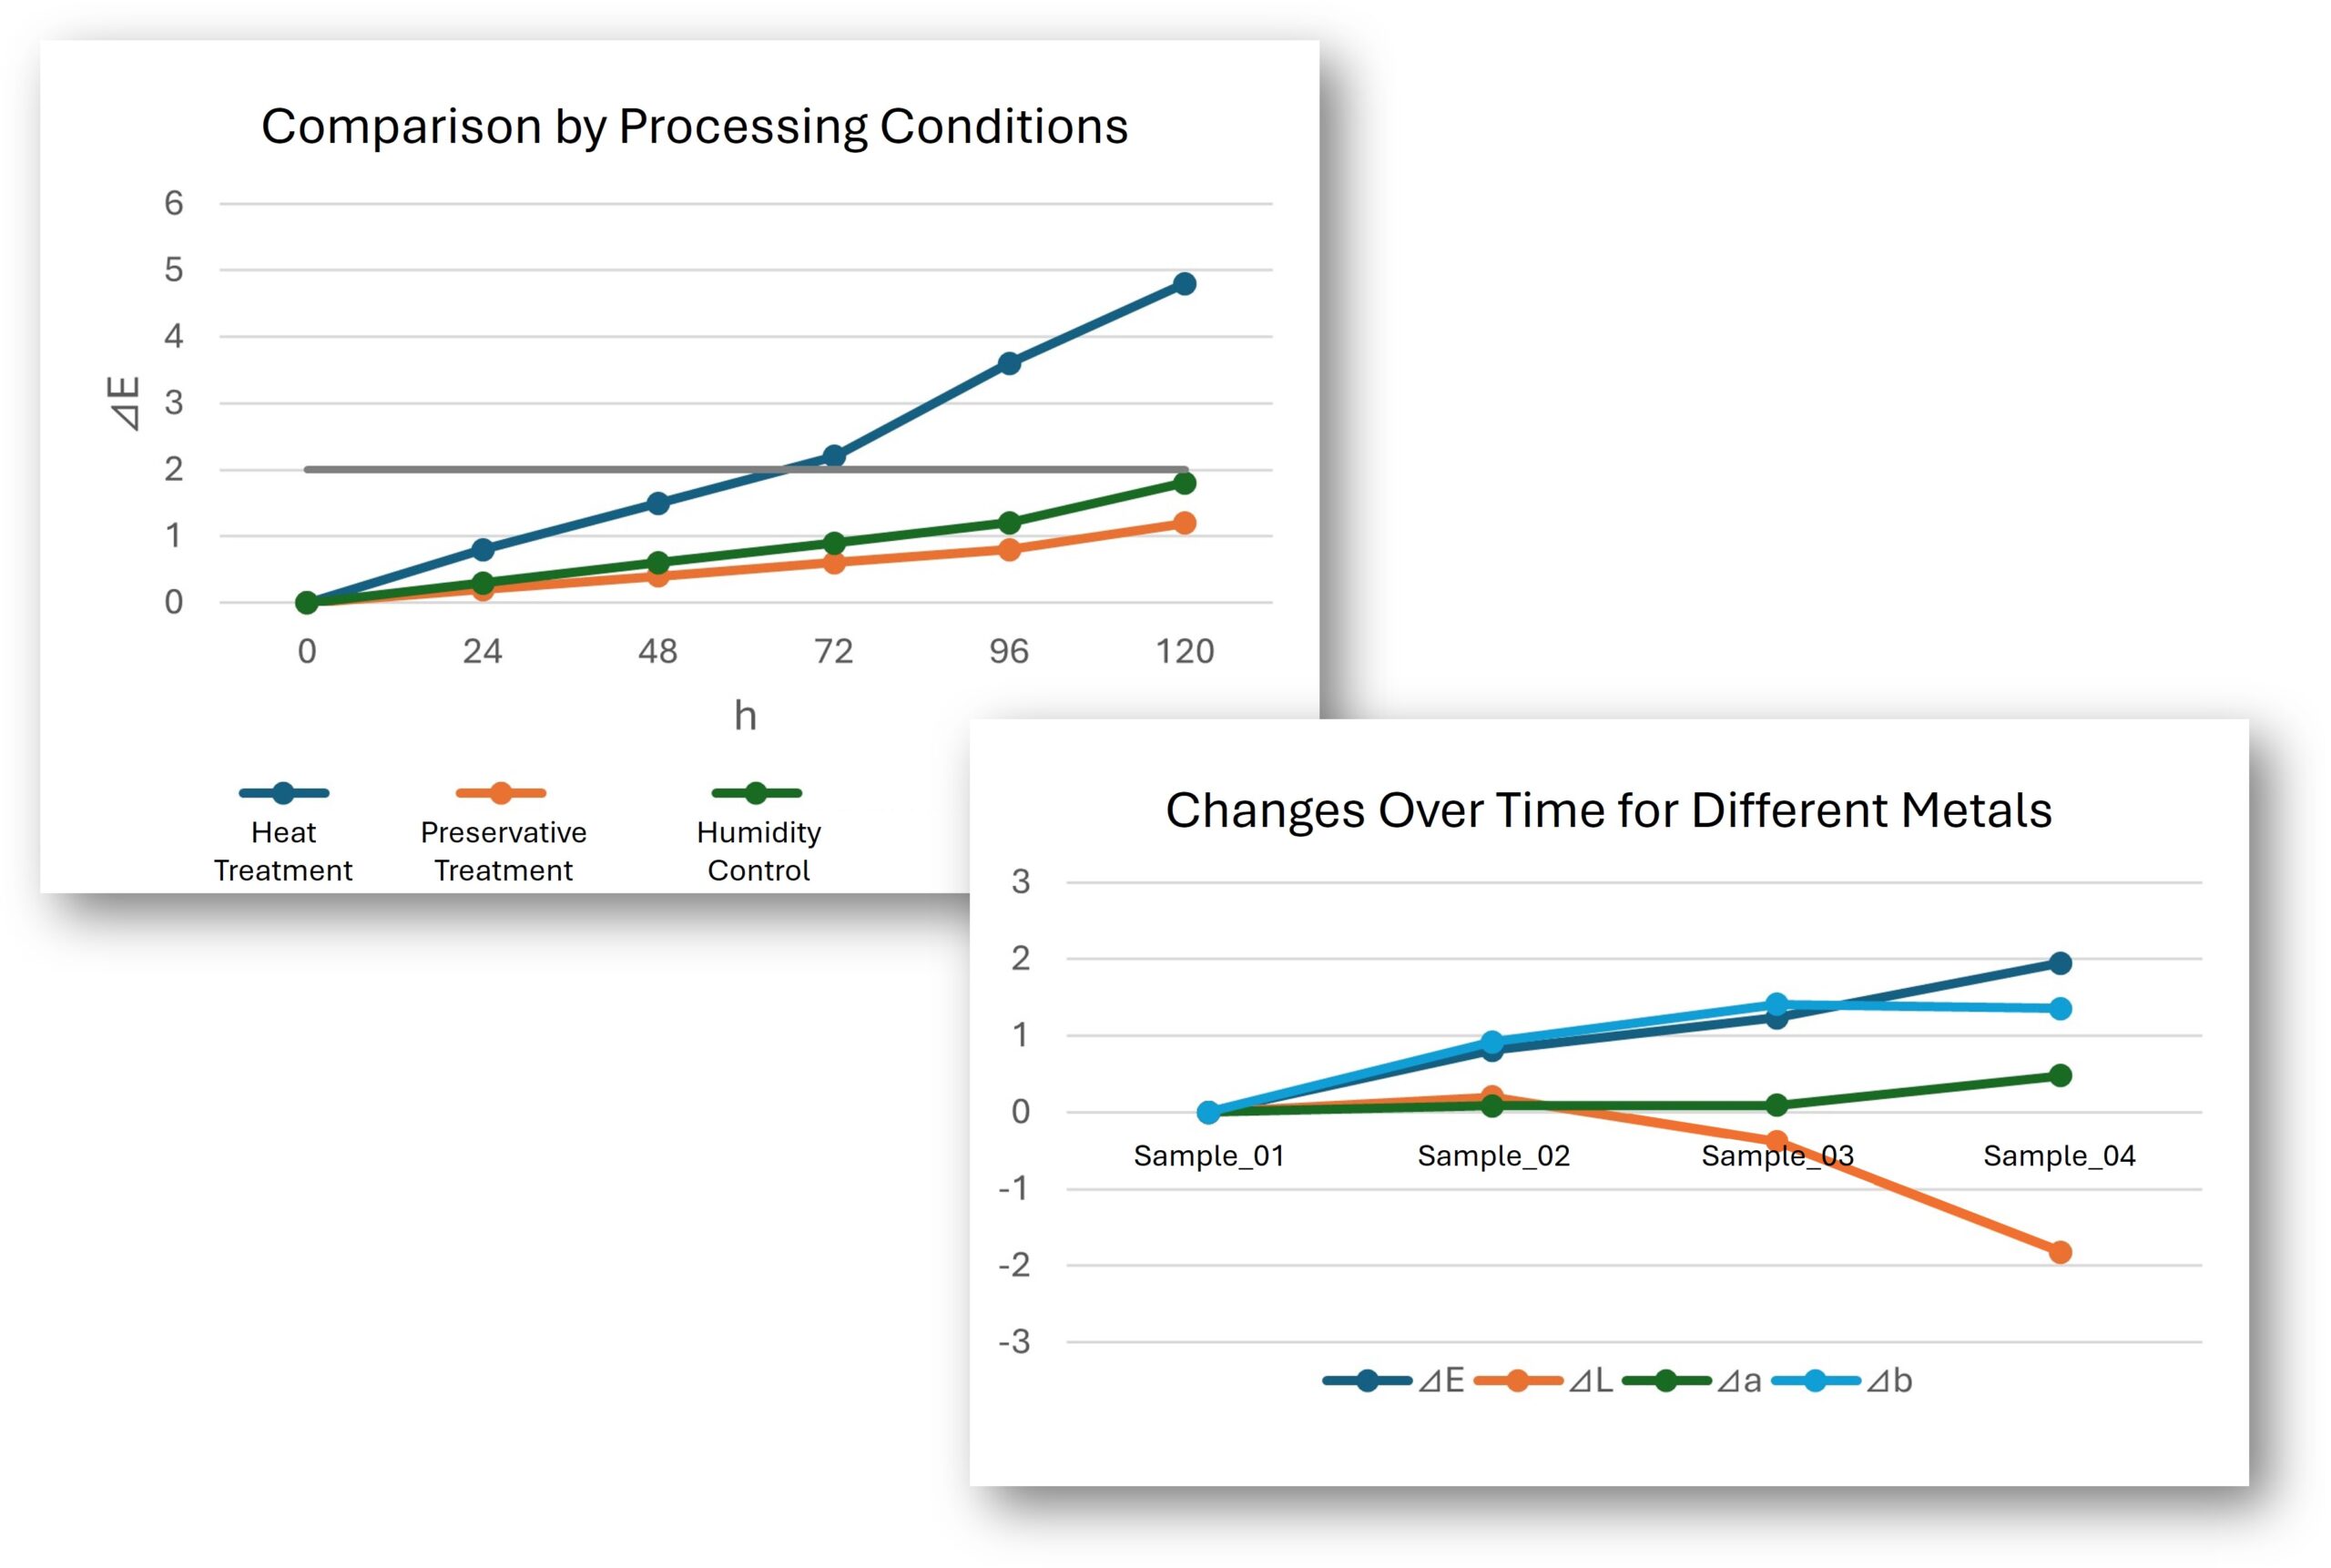
By combining numerical data with images, changes can be both visualized and quantified. When evaluating the progression of oxidation or rust, plotting color difference (ΔE) over time makes trends easier to identify and compare. Converting visual changes into quantitative data also makes it easier to communicate results clearly to customers, management, and other stakeholders.
Contact
Please feel free to contact us with any inquiries regarding our products, pricing, or quotations.
We also accommodate requests such as “I would like to see how measurement works in practice.”
Trial measurements are available, allowing you to experience actual measurement results firsthand.