Liquids

Non-Contact Evaluation of Liquids in Containers
Overview
For liquid products, changes in color, transparency, and overall appearance can be important indicators of quality. In industries such as food and beverages, cosmetics, coatings, chemicals, and pharmaceuticals, it is often necessary to compare quality between production lots and monitor changes during storage. Unlike solid samples, however, the appearance of liquids can be affected by factors such as container shape, liquid volume, and light transmission, making objective evaluation challenging.
In addition, sampling, transferring, or handling the liquid for measurement may affect the condition of the sample, making some conventional measurement methods difficult to apply. Even with non-contact instruments, samples often need to be transferred into dedicated cells or containers, adding preparation time and potentially introducing contamination or changes in measurement conditions. As a result, continuously evaluating liquids in the containers in which they are stored or sold can be difficult, creating challenges for quality control and long-term monitoring.
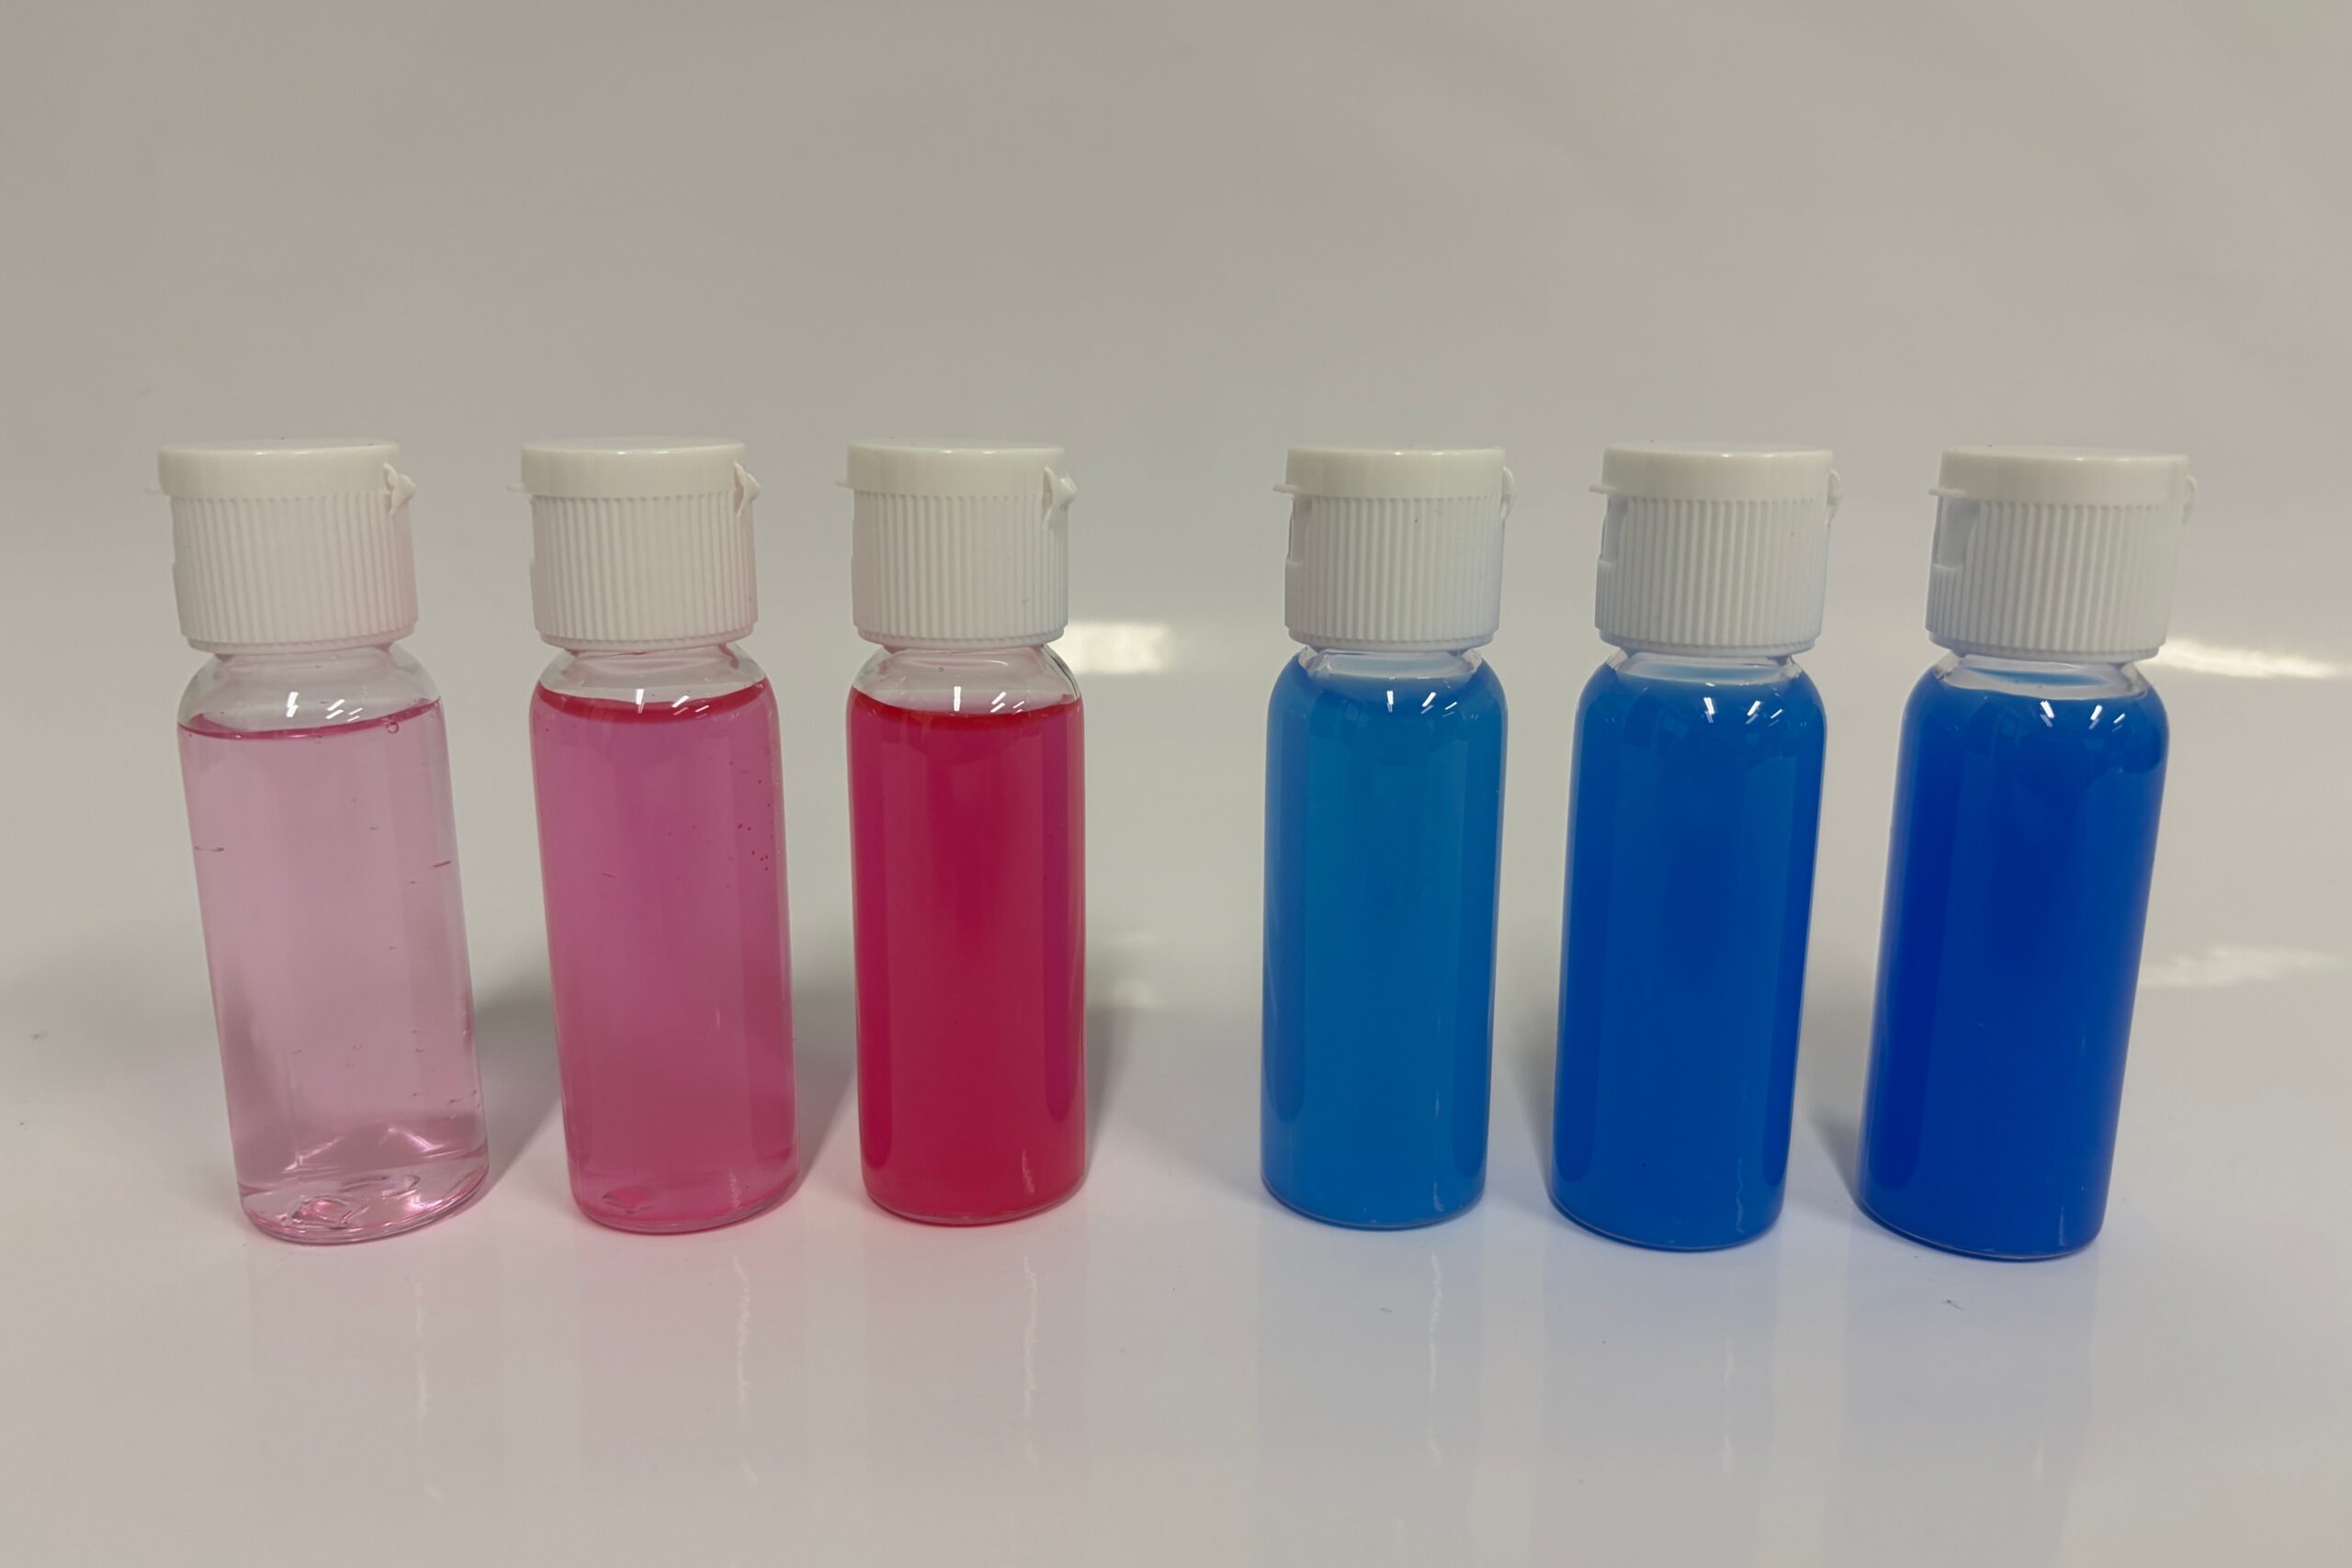
Sample
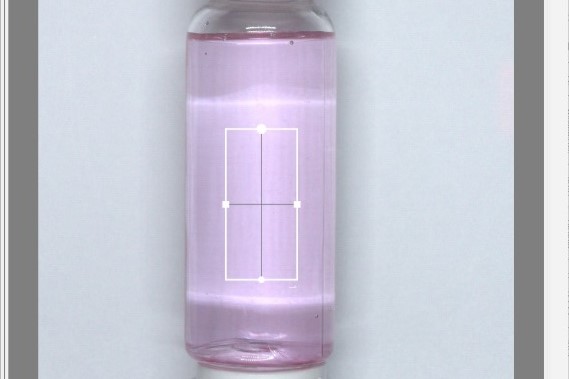
Captured Image and Measurement Area
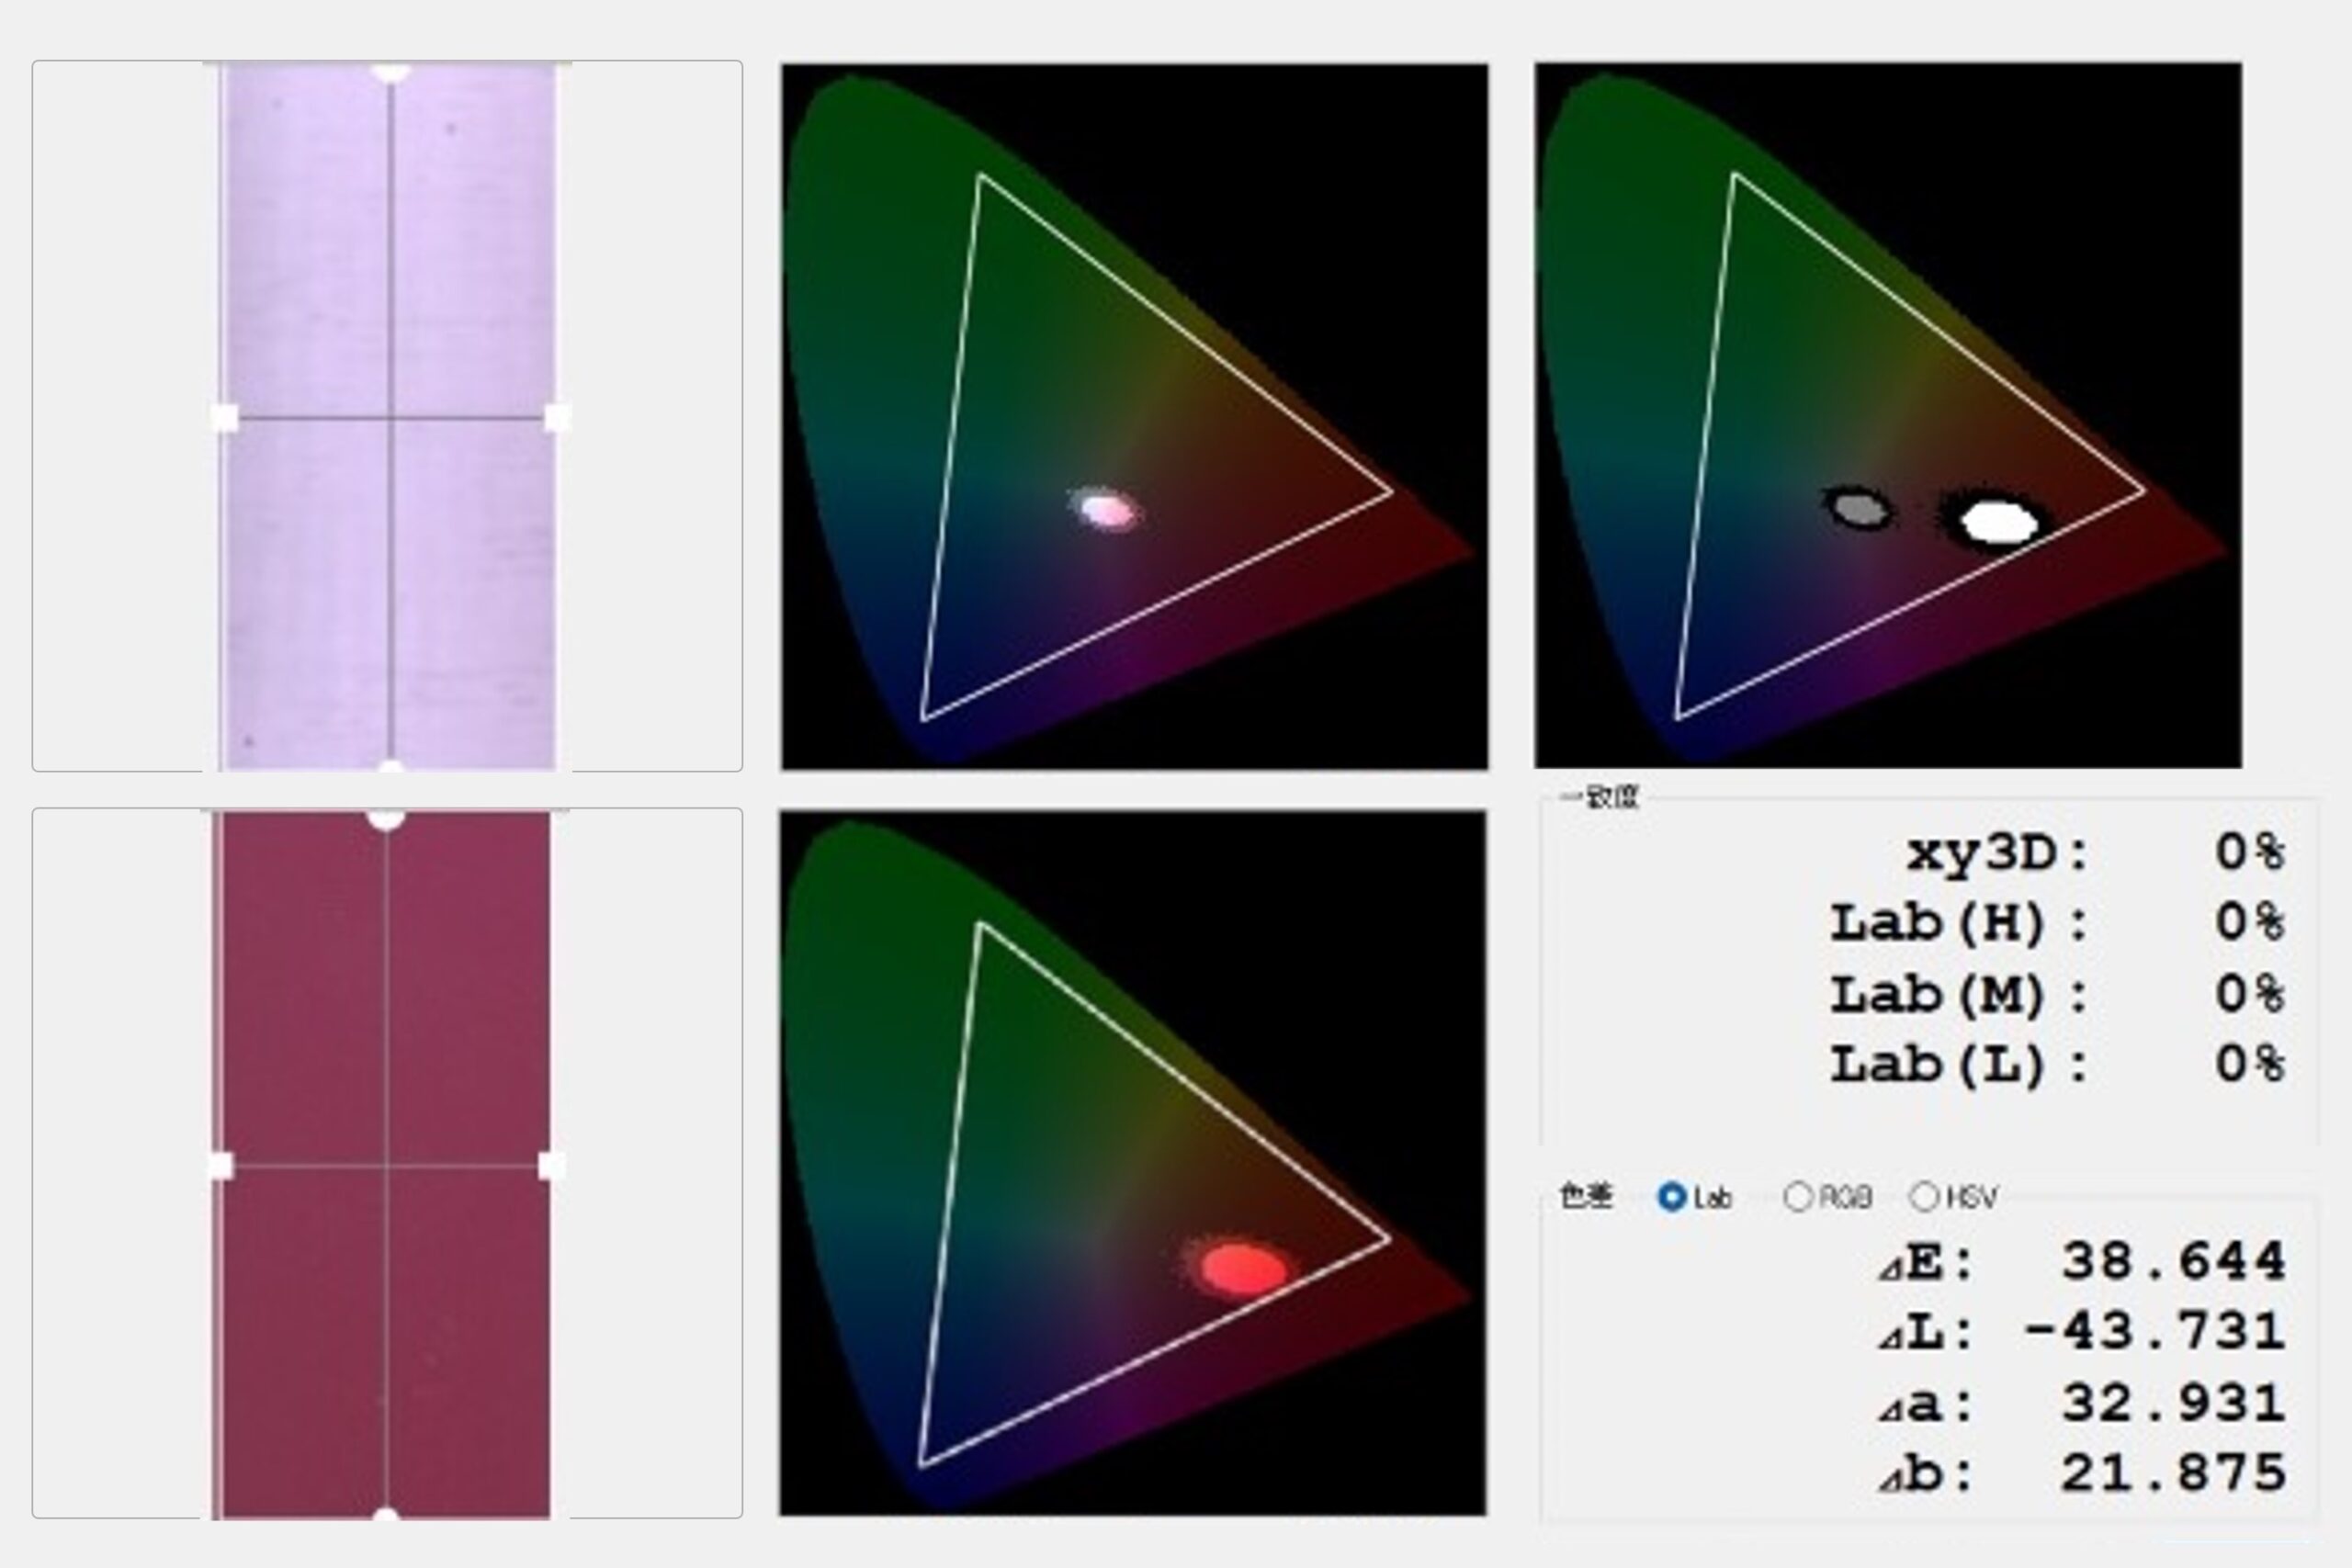
Measurement Results Screen
Customer Challenges
Challenges
Challenges of Visual Evaluation and the Need for Non-Contact Measurement
Evaluating the color of liquids can be challenging because container shape and liquid volume may vary, while appearance can also be affected by light reflection, transmission, and surrounding conditions. These factors can make it difficult to achieve objective and reproducible evaluation. As a result, many production sites rely on visual judgment and operator experience, which can lead to variation in results from one evaluator to another.
Conventional measurement methods may require sampling or handling, which can affect the condition of the liquid. The risk of contamination and variations in measurement conditions can create additional challenges. Furthermore, it can be difficult to quantitatively track differences between production lots or changes during storage, making early detection of abnormalities and analysis of quality trends more difficult.
Benefits After Implementation
Improve Quality Control with Reproducible, Non-Contact Measurement
A 2D color measurement system enables non-contact measurement of liquids while they remain in their containers, allowing differences in color and overall appearance to be quantified. Replacing subjective visual judgment with numerical data helps reduce variation between evaluators and supports quality control based on consistent criteria. Measurement results can also be recorded as numerical data and graphs, supporting the accumulation of quality data and improved traceability.
In addition, liquids in transparent containers can be measured repeatedly without transferring the sample, making it possible to quantitatively compare changes in the same sample over time as well as differences between production lots. This can help identify signs of quality variation and provide objective data for product development and quality assurance.
Measurement Methods
1. Capture the reference:
Place the reference liquid sample in the system and capture an image. Define the measurement area in the captured image and save it as the reference data.
2. Inspect the sample:
Capture an image of the sample under the same conditions. By aligning the sample position and measurement area with the reference settings, the sample can be evaluated consistently.
3. View the results:
The measurement screen displays average L*, a*, and b* values, color difference (ΔE), color distribution, and deviations from the reference sample. Measurement images and numerical data can be saved and exported for comparison between production lots or measurement conditions.
Analysis Image
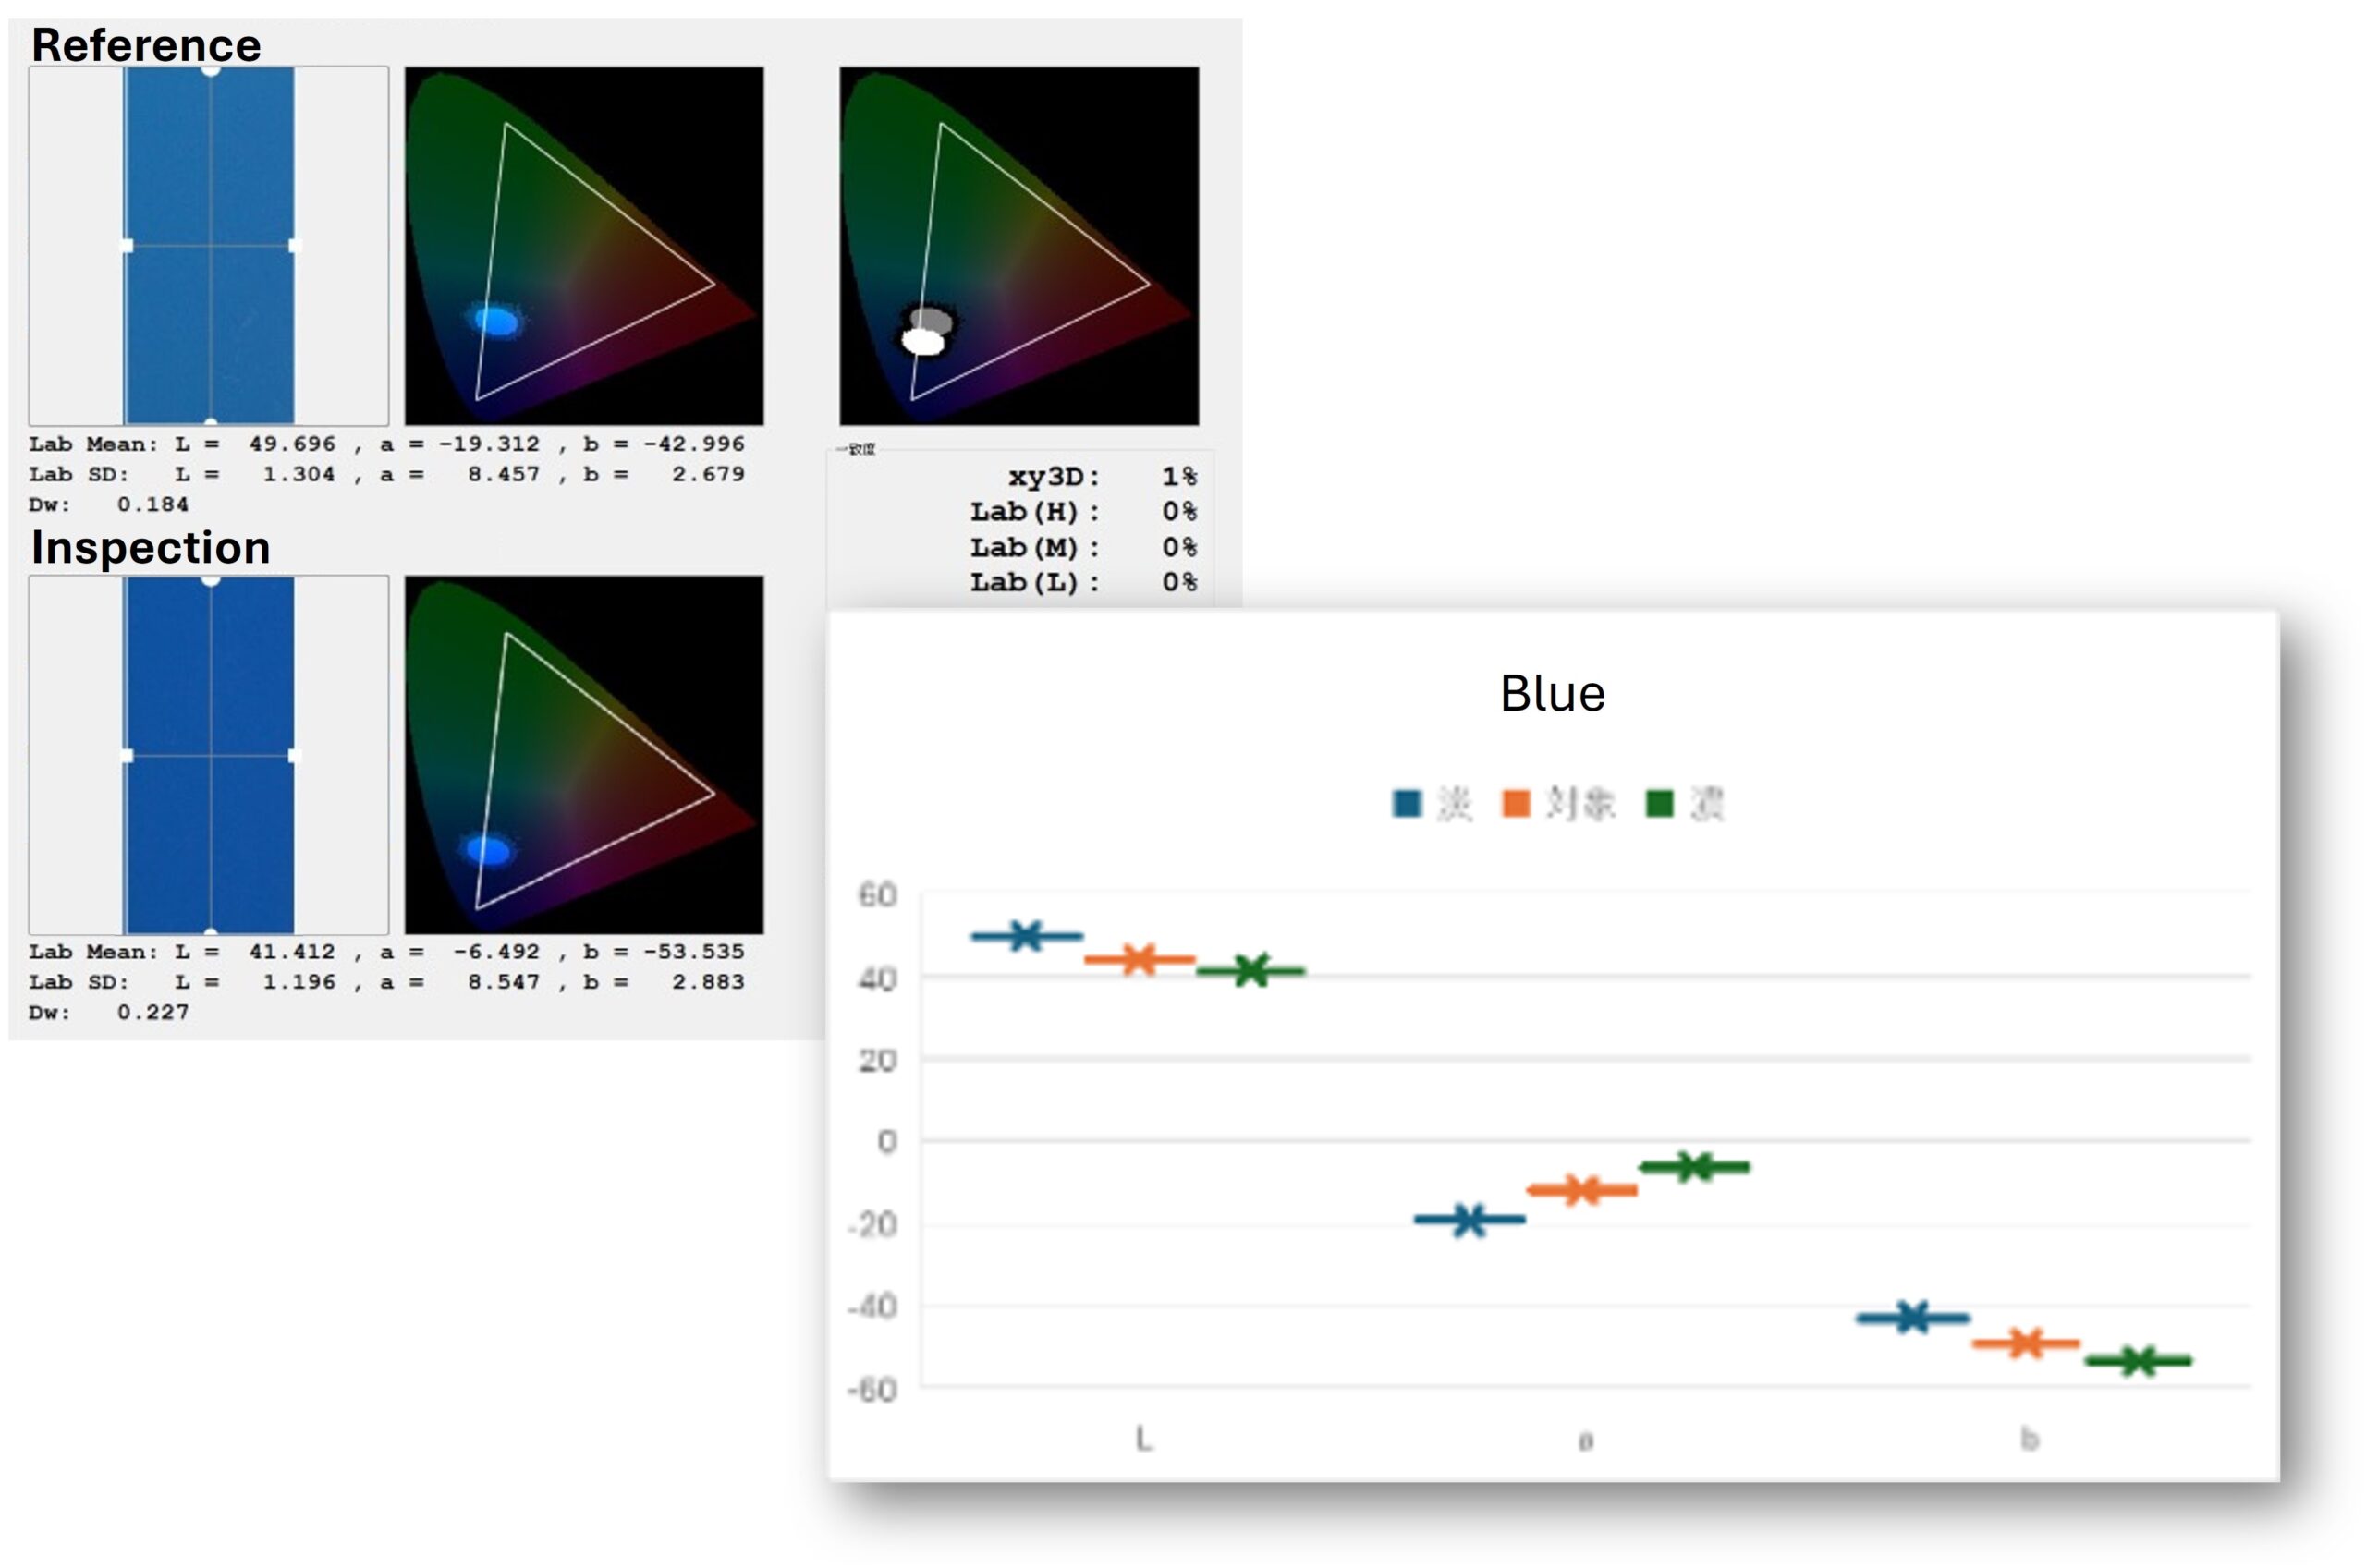
Differences in the color and overall appearance of liquid samples can be quantified using 2D color measurement and compared with predefined control criteria to determine whether each sample falls within the specified range. Subtle changes that may be difficult to identify visually can be quantified, helping reduce variation caused by differences in operator experience. Captured images and measurement data can also be saved, allowing quality changes and trends to be monitored over time. This supports a more consistent and reproducible quality control process based on objective data rather than individual judgment.
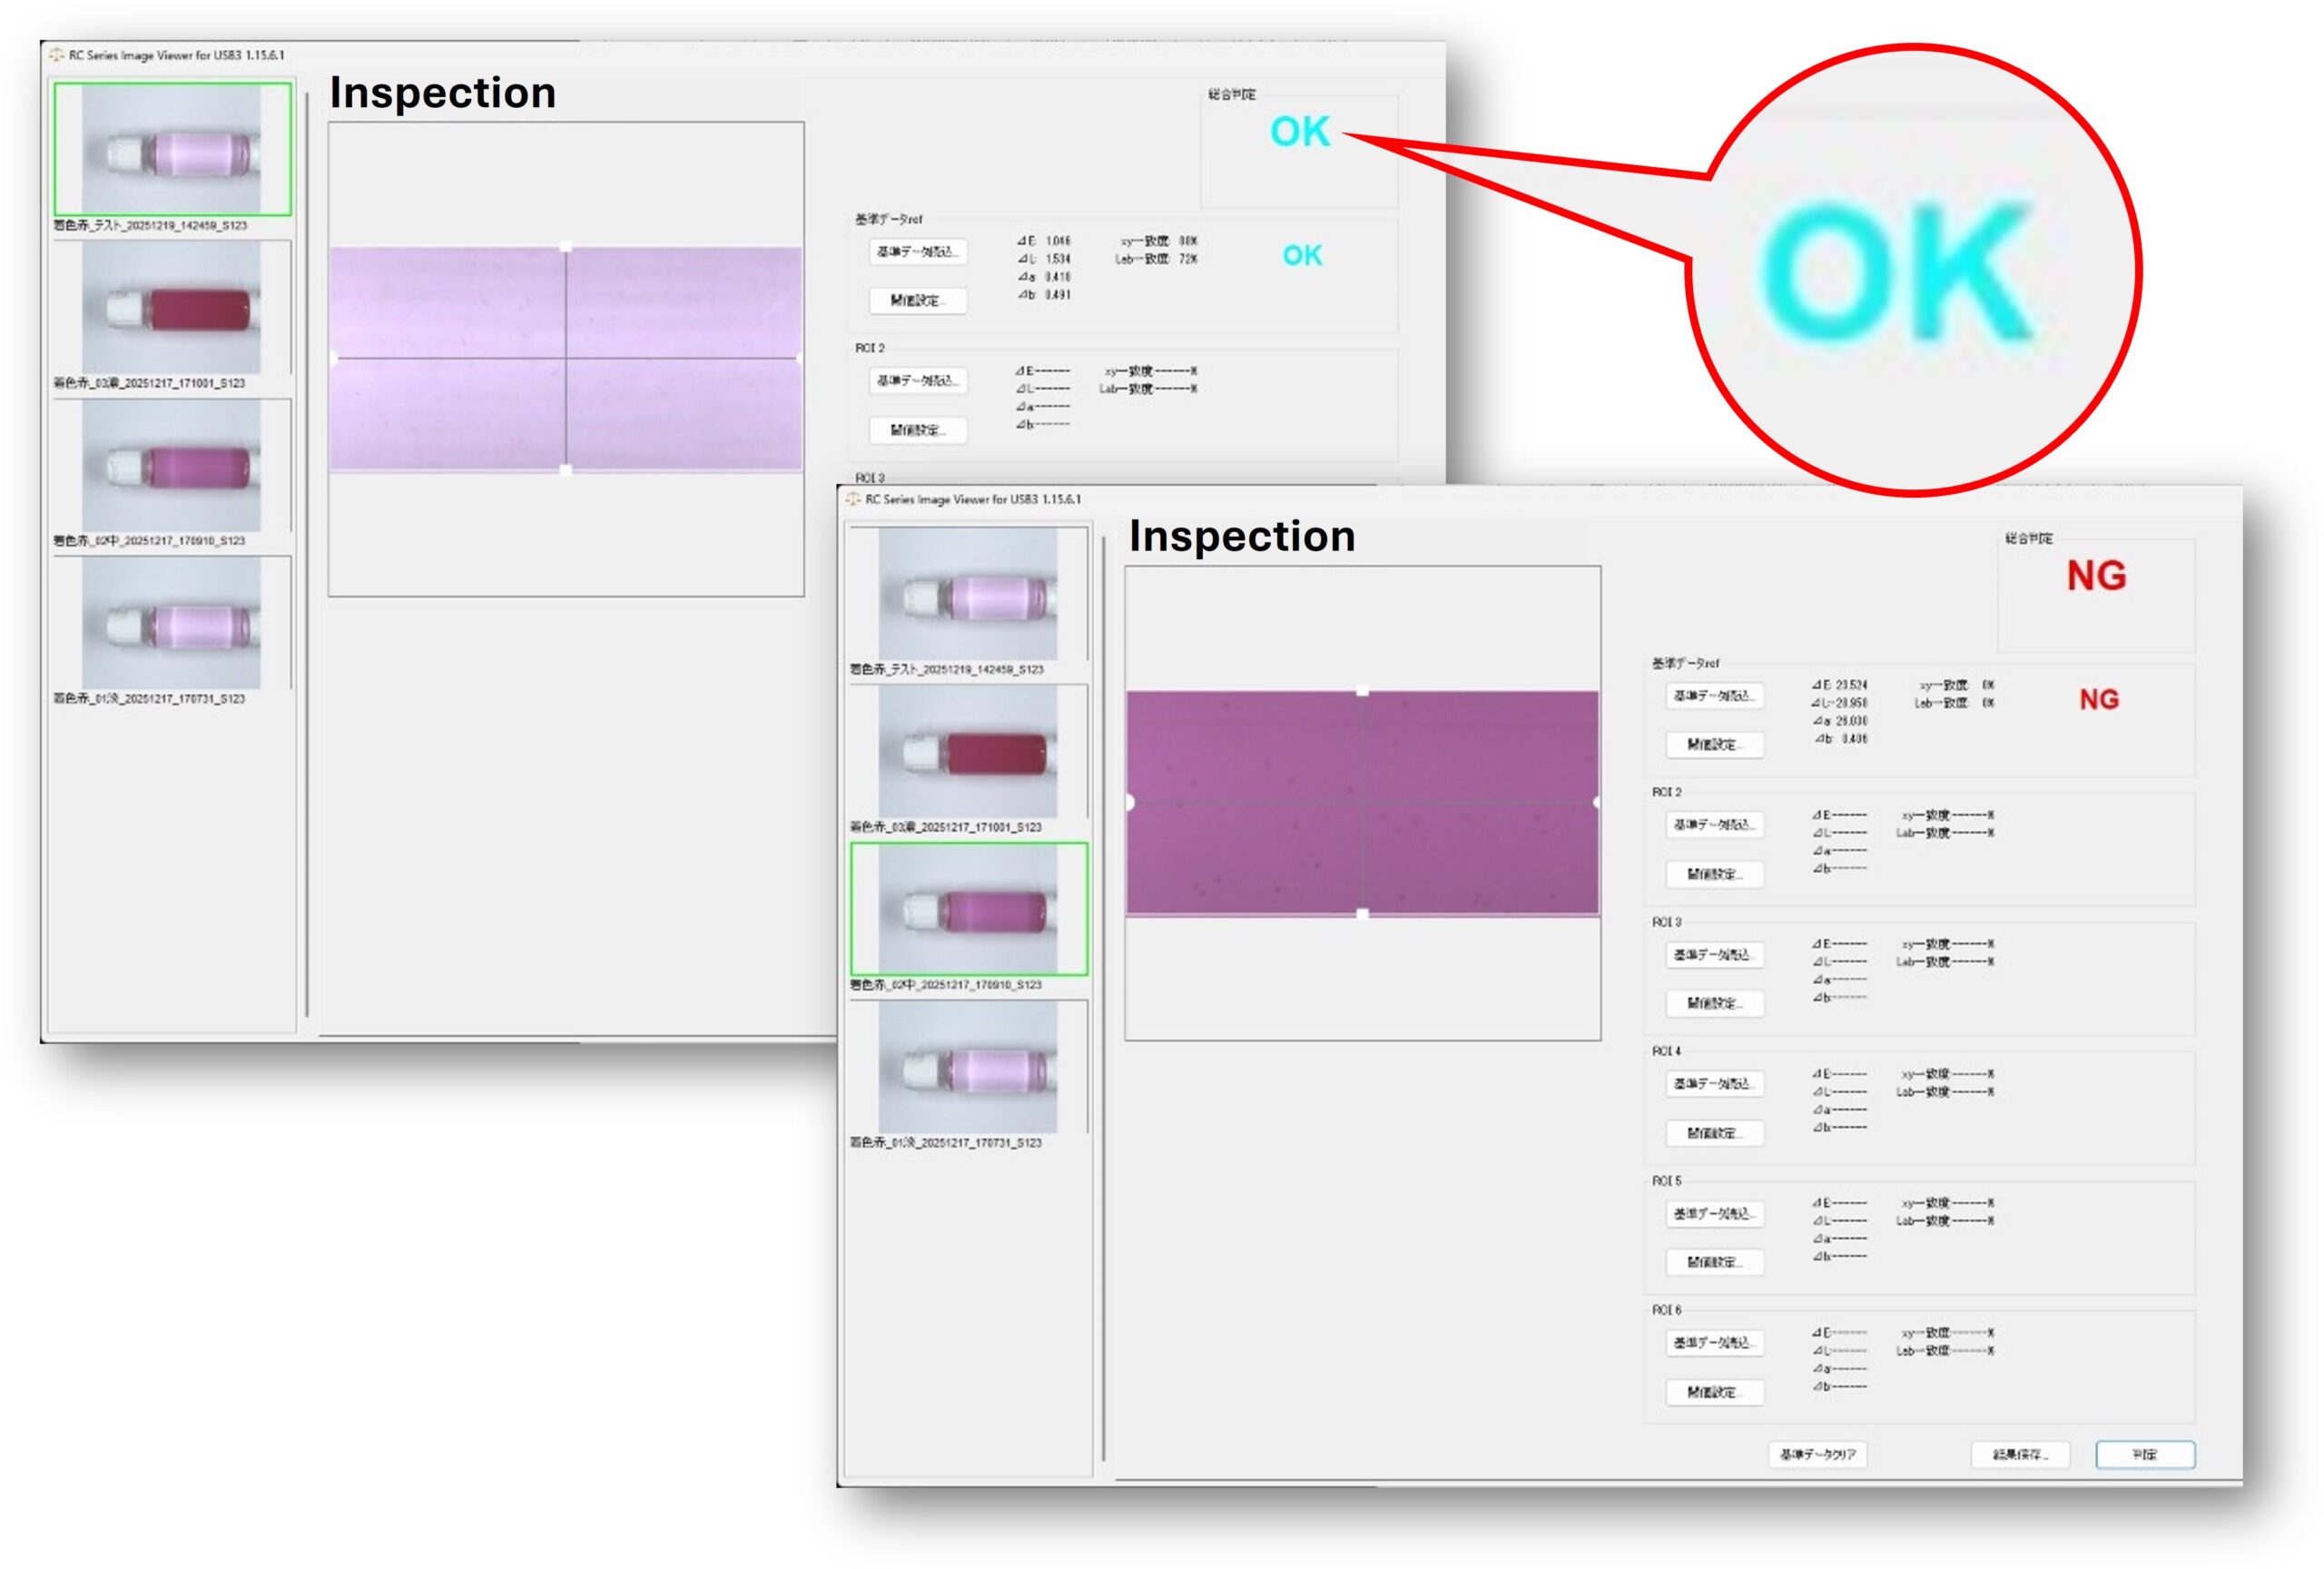
Measurement results can be automatically compared with predefined thresholds to provide an immediate pass/fail judgment for each product or sample. Clearly defined evaluation criteria help reduce differences between operators and support consistent inspection results. The same evaluation criteria can also be shared across multiple operators or locations, supporting more standardized quality control. Results can be reviewed intuitively on screen, helping identify values outside the specified range and reduce the risk of nonconforming products proceeding to the next process or being shipped. This can support both more efficient inspection and more consistent quality assurance.
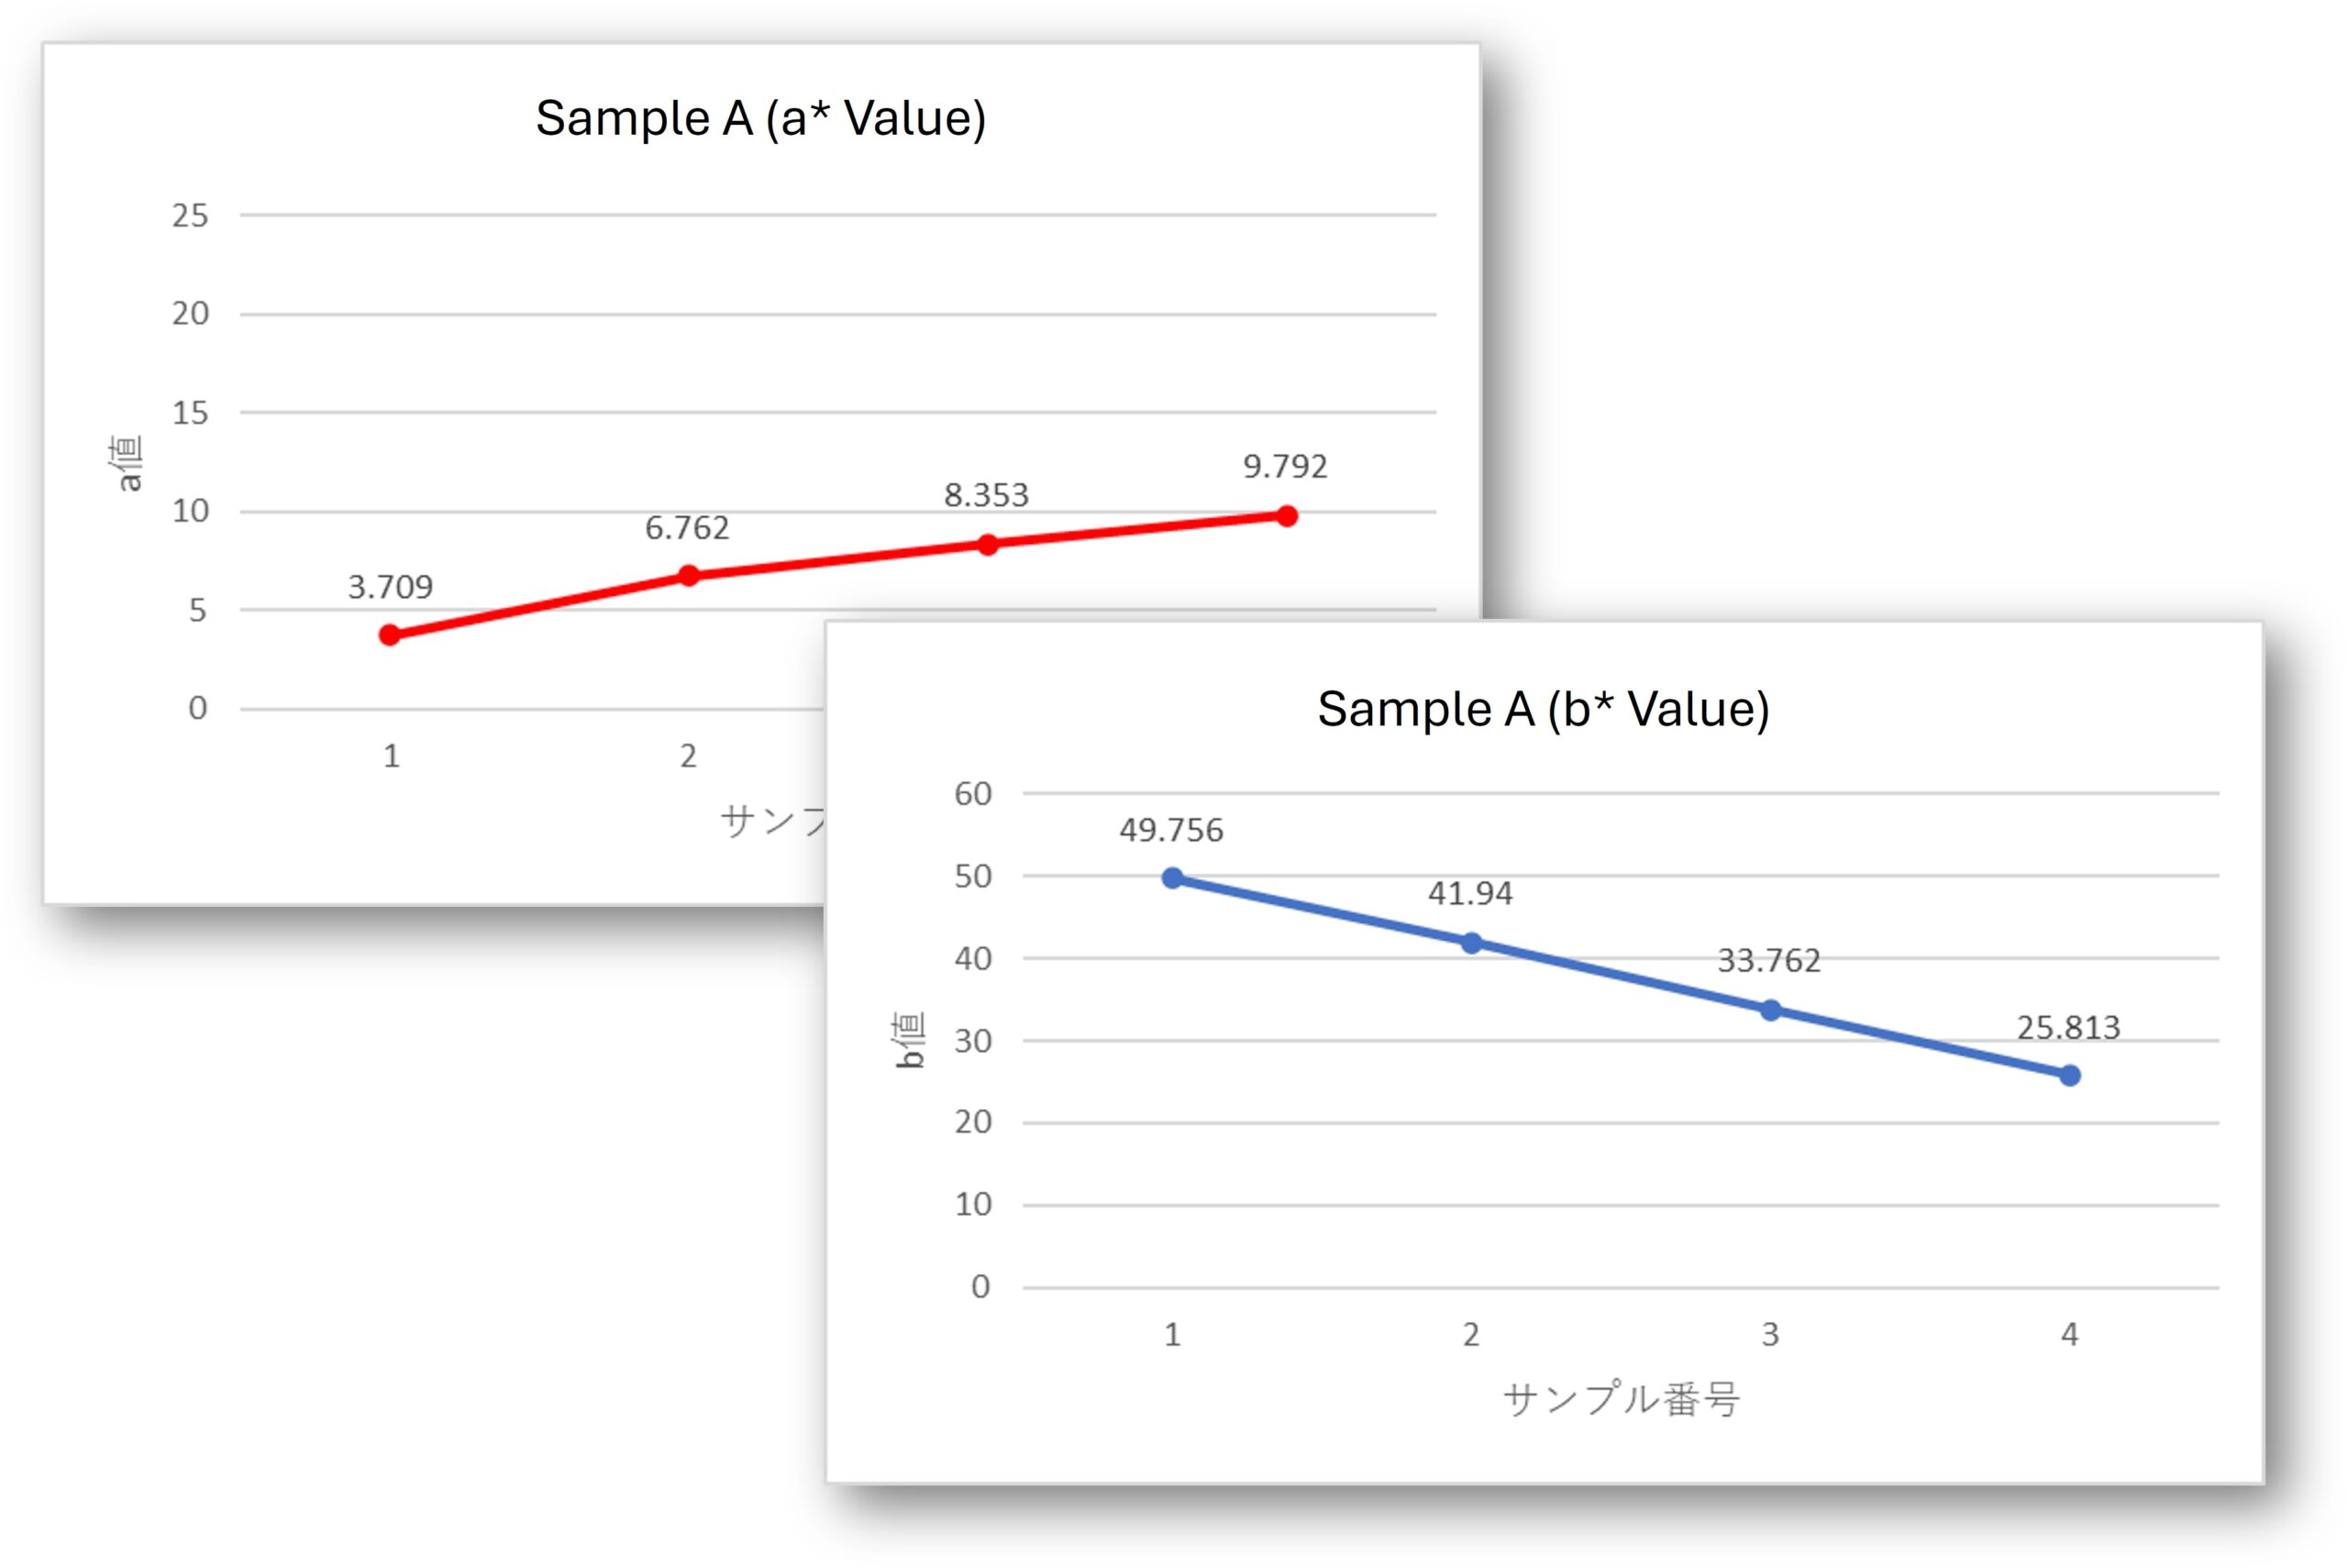
Liquids in PET bottles or other transparent containers can be measured without opening or transferring the sample, allowing the same sample to be monitored over extended periods without destructive sampling. Measurement results can be plotted over time, making it possible to quantitatively track color changes and deterioration trends. The resulting data can provide an objective basis for evaluation in storage tests, quality assurance, and product development. Changes that were previously judged mainly through visual observation or experience can instead be explained using numerical data, supporting more evidence-based quality control.
Contact
Please feel free to contact us with any inquiries regarding our products, pricing, or quotations.
We also accommodate requests such as “I would like to see how measurement works in practice.”
Trial measurements are available, allowing you to experience actual measurement results firsthand.